Turkish vs Iranian Householder Income Ages 45 - 64 years
COMPARE
Turkish
Iranian
Householder Income Ages 45 - 64 years
Householder Income Ages 45 - 64 years Comparison
Turks
Iranians
$117,814
HOUSEHOLDER INCOME AGES 45 - 64 YEARS
100.0/ 100
METRIC RATING
28th/ 347
METRIC RANK
$129,350
HOUSEHOLDER INCOME AGES 45 - 64 YEARS
100.0/ 100
METRIC RATING
6th/ 347
METRIC RANK
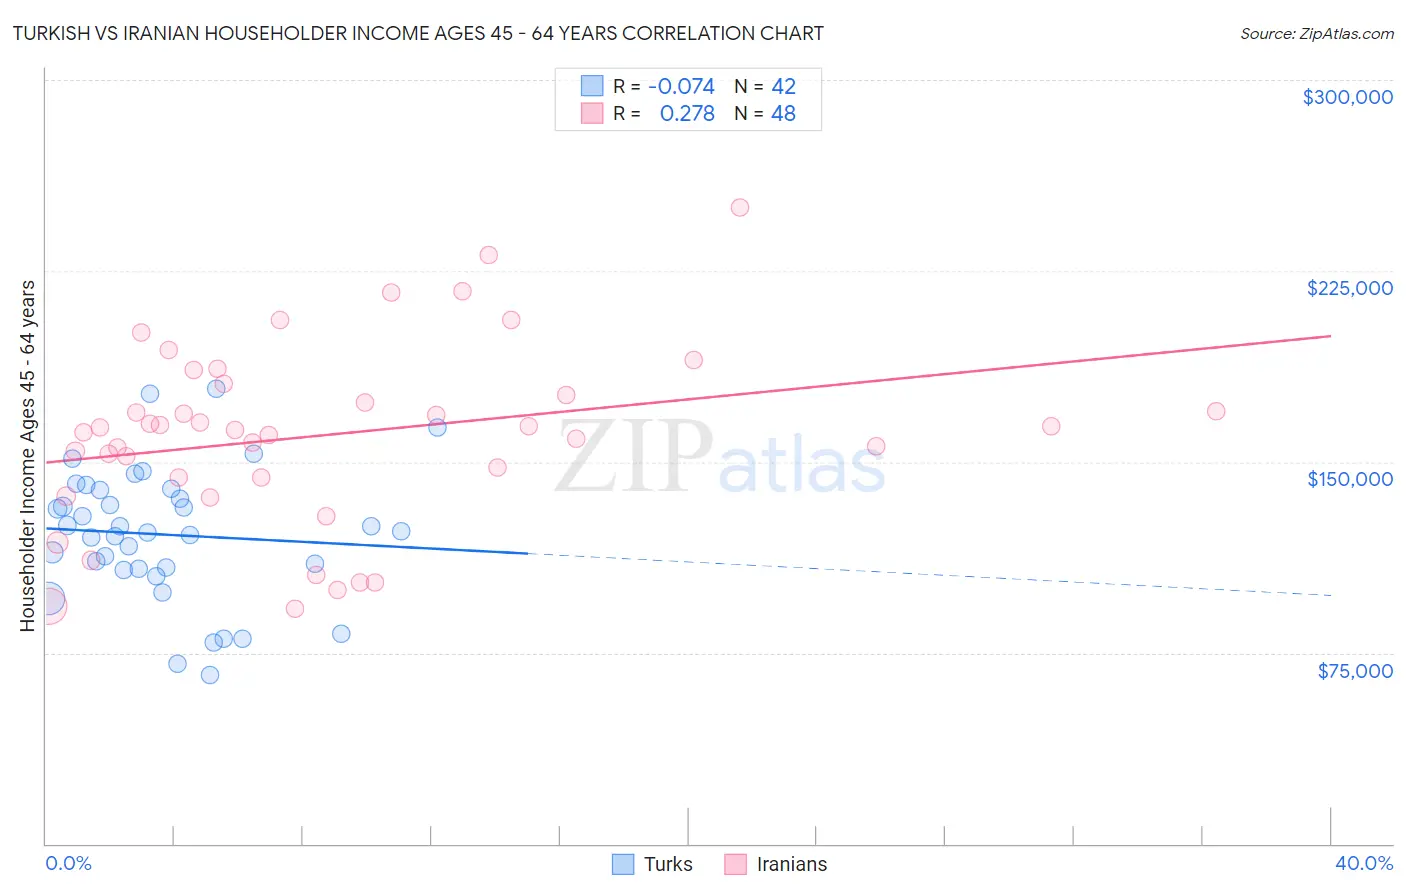
Turkish vs Iranian Householder Income Ages 45 - 64 years Correlation Chart
The statistical analysis conducted on geographies consisting of 271,498,230 people shows a slight negative correlation between the proportion of Turks and household income with householder between the ages 45 and 64 in the United States with a correlation coefficient (R) of -0.074 and weighted average of $117,814. Similarly, the statistical analysis conducted on geographies consisting of 316,454,523 people shows a weak positive correlation between the proportion of Iranians and household income with householder between the ages 45 and 64 in the United States with a correlation coefficient (R) of 0.278 and weighted average of $129,350, a difference of 9.8%.
Householder Income Ages 45 - 64 years Correlation Summary
| Measurement | Turkish | Iranian |
| Minimum | $66,250 | $92,091 |
| Maximum | $178,523 | $250,001 |
| Range | $112,273 | $157,910 |
| Mean | $121,410 | $160,647 |
| Median | $122,614 | $162,915 |
| Interquartile 25% (IQ1) | $107,799 | $143,809 |
| Interquartile 75% (IQ3) | $139,122 | $178,661 |
| Interquartile Range (IQR) | $31,324 | $34,851 |
| Standard Deviation (Sample) | $26,168 | $35,600 |
| Standard Deviation (Population) | $25,855 | $35,228 |
Similar Demographics by Householder Income Ages 45 - 64 years
Demographics Similar to Turks by Householder Income Ages 45 - 64 years
In terms of householder income ages 45 - 64 years, the demographic groups most similar to Turks are Bhutanese ($117,750, a difference of 0.050%), Immigrants from Bolivia ($117,731, a difference of 0.070%), Immigrants from Northern Europe ($117,930, a difference of 0.10%), Immigrants from Sweden ($118,318, a difference of 0.43%), and Asian ($118,426, a difference of 0.52%).
| Demographics | Rating | Rank | Householder Income Ages 45 - 64 years |
| Immigrants | Sri Lanka | 100.0 /100 | #21 | Exceptional $119,094 |
| Immigrants | Belgium | 100.0 /100 | #22 | Exceptional $118,932 |
| Bolivians | 100.0 /100 | #23 | Exceptional $118,871 |
| Immigrants | Japan | 100.0 /100 | #24 | Exceptional $118,498 |
| Asians | 100.0 /100 | #25 | Exceptional $118,426 |
| Immigrants | Sweden | 100.0 /100 | #26 | Exceptional $118,318 |
| Immigrants | Northern Europe | 100.0 /100 | #27 | Exceptional $117,930 |
| Turks | 100.0 /100 | #28 | Exceptional $117,814 |
| Bhutanese | 100.0 /100 | #29 | Exceptional $117,750 |
| Immigrants | Bolivia | 100.0 /100 | #30 | Exceptional $117,731 |
| Immigrants | Asia | 100.0 /100 | #31 | Exceptional $116,566 |
| Russians | 100.0 /100 | #32 | Exceptional $116,328 |
| Chinese | 100.0 /100 | #33 | Exceptional $116,156 |
| Immigrants | Denmark | 100.0 /100 | #34 | Exceptional $116,000 |
| Latvians | 100.0 /100 | #35 | Exceptional $115,957 |
Demographics Similar to Iranians by Householder Income Ages 45 - 64 years
In terms of householder income ages 45 - 64 years, the demographic groups most similar to Iranians are Immigrants from Singapore ($129,514, a difference of 0.13%), Thai ($129,560, a difference of 0.16%), Immigrants from Hong Kong ($127,500, a difference of 1.5%), Immigrants from Iran ($126,940, a difference of 1.9%), and Immigrants from India ($132,488, a difference of 2.4%).
| Demographics | Rating | Rank | Householder Income Ages 45 - 64 years |
| Immigrants | Taiwan | 100.0 /100 | #1 | Exceptional $135,508 |
| Filipinos | 100.0 /100 | #2 | Exceptional $134,910 |
| Immigrants | India | 100.0 /100 | #3 | Exceptional $132,488 |
| Thais | 100.0 /100 | #4 | Exceptional $129,560 |
| Immigrants | Singapore | 100.0 /100 | #5 | Exceptional $129,514 |
| Iranians | 100.0 /100 | #6 | Exceptional $129,350 |
| Immigrants | Hong Kong | 100.0 /100 | #7 | Exceptional $127,500 |
| Immigrants | Iran | 100.0 /100 | #8 | Exceptional $126,940 |
| Okinawans | 100.0 /100 | #9 | Exceptional $124,796 |
| Immigrants | South Central Asia | 100.0 /100 | #10 | Exceptional $124,188 |
| Cypriots | 100.0 /100 | #11 | Exceptional $123,396 |
| Immigrants | Israel | 100.0 /100 | #12 | Exceptional $122,893 |
| Immigrants | Ireland | 100.0 /100 | #13 | Exceptional $122,757 |
| Indians (Asian) | 100.0 /100 | #14 | Exceptional $122,343 |
| Immigrants | Eastern Asia | 100.0 /100 | #15 | Exceptional $122,222 |