Turkish vs Indian (Asian) Householder Income Over 65 years
COMPARE
Turkish
Indian (Asian)
Householder Income Over 65 years
Householder Income Over 65 years Comparison
Turks
Indians (Asian)
$68,037
HOUSEHOLDER INCOME OVER 65 YEARS
99.9/ 100
METRIC RATING
37th/ 347
METRIC RANK
$70,238
HOUSEHOLDER INCOME OVER 65 YEARS
100.0/ 100
METRIC RATING
19th/ 347
METRIC RANK
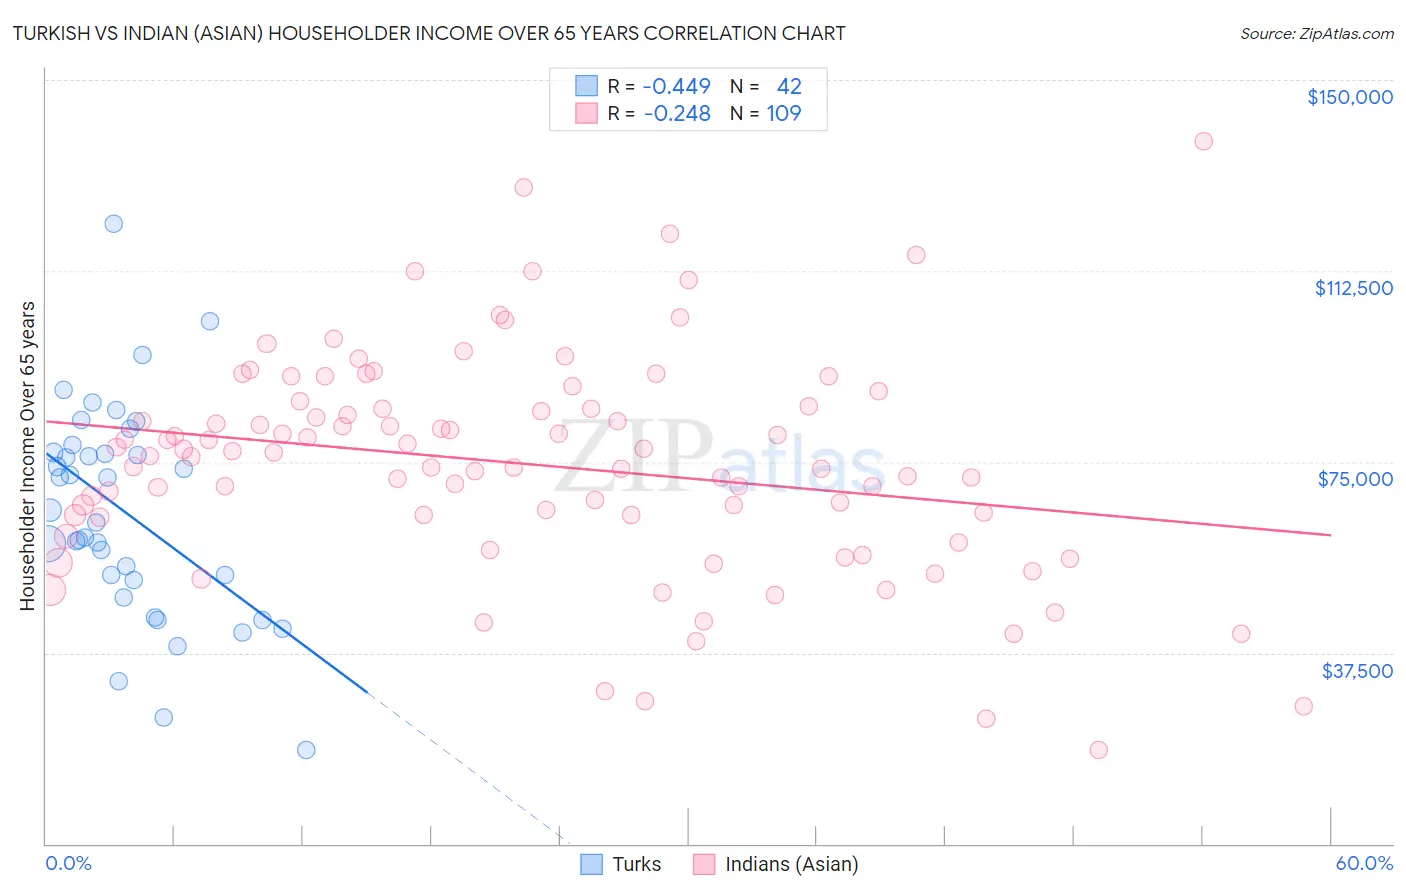
Turkish vs Indian (Asian) Householder Income Over 65 years Correlation Chart
The statistical analysis conducted on geographies consisting of 271,295,449 people shows a moderate negative correlation between the proportion of Turks and household income with householder over the age of 65 in the United States with a correlation coefficient (R) of -0.449 and weighted average of $68,037. Similarly, the statistical analysis conducted on geographies consisting of 492,472,602 people shows a weak negative correlation between the proportion of Indians (Asian) and household income with householder over the age of 65 in the United States with a correlation coefficient (R) of -0.248 and weighted average of $70,238, a difference of 3.2%.
Householder Income Over 65 years Correlation Summary
| Measurement | Turkish | Indian (Asian) |
| Minimum | $18,472 | $18,324 |
| Maximum | $121,806 | $137,919 |
| Range | $103,334 | $119,595 |
| Mean | $64,935 | $74,584 |
| Median | $64,229 | $76,155 |
| Interquartile 25% (IQ1) | $51,875 | $64,279 |
| Interquartile 75% (IQ3) | $76,840 | $85,582 |
| Interquartile Range (IQR) | $24,964 | $21,303 |
| Standard Deviation (Sample) | $21,025 | $21,534 |
| Standard Deviation (Population) | $20,773 | $21,435 |
Demographics Similar to Turks and Indians (Asian) by Householder Income Over 65 years
In terms of householder income over 65 years, the demographic groups most similar to Turks are Estonian ($67,926, a difference of 0.16%), Immigrants from Austria ($68,208, a difference of 0.25%), Tongan ($68,235, a difference of 0.29%), Immigrants from Ireland ($68,495, a difference of 0.67%), and Immigrants from Denmark ($68,801, a difference of 1.1%). Similarly, the demographic groups most similar to Indians (Asian) are Immigrants from South Central Asia ($70,103, a difference of 0.19%), Eastern European ($70,470, a difference of 0.33%), Immigrants from Eastern Asia ($69,872, a difference of 0.52%), Immigrants from Israel ($69,857, a difference of 0.55%), and Immigrants from Japan ($69,774, a difference of 0.67%).
| Demographics | Rating | Rank | Householder Income Over 65 years |
| Eastern Europeans | 100.0 /100 | #18 | Exceptional $70,470 |
| Indians (Asian) | 100.0 /100 | #19 | Exceptional $70,238 |
| Immigrants | South Central Asia | 100.0 /100 | #20 | Exceptional $70,103 |
| Immigrants | Eastern Asia | 100.0 /100 | #21 | Exceptional $69,872 |
| Immigrants | Israel | 100.0 /100 | #22 | Exceptional $69,857 |
| Immigrants | Japan | 100.0 /100 | #23 | Exceptional $69,774 |
| Immigrants | Sweden | 100.0 /100 | #24 | Exceptional $69,722 |
| Immigrants | Belgium | 100.0 /100 | #25 | Exceptional $69,703 |
| Immigrants | Sri Lanka | 100.0 /100 | #26 | Exceptional $69,426 |
| Immigrants | Switzerland | 100.0 /100 | #27 | Exceptional $69,343 |
| Immigrants | China | 100.0 /100 | #28 | Exceptional $69,174 |
| Immigrants | Australia | 100.0 /100 | #29 | Exceptional $69,164 |
| Immigrants | Northern Europe | 100.0 /100 | #30 | Exceptional $69,003 |
| Afghans | 100.0 /100 | #31 | Exceptional $68,951 |
| Asians | 100.0 /100 | #32 | Exceptional $68,822 |
| Immigrants | Denmark | 100.0 /100 | #33 | Exceptional $68,801 |
| Immigrants | Ireland | 100.0 /100 | #34 | Exceptional $68,495 |
| Tongans | 100.0 /100 | #35 | Exceptional $68,235 |
| Immigrants | Austria | 99.9 /100 | #36 | Exceptional $68,208 |
| Turks | 99.9 /100 | #37 | Exceptional $68,037 |
| Estonians | 99.9 /100 | #38 | Exceptional $67,926 |