Turkish vs Immigrants from Western Europe Householder Income Over 65 years
COMPARE
Turkish
Immigrants from Western Europe
Householder Income Over 65 years
Householder Income Over 65 years Comparison
Turks
Immigrants from Western Europe
$68,037
HOUSEHOLDER INCOME OVER 65 YEARS
99.9/ 100
METRIC RATING
37th/ 347
METRIC RANK
$64,933
HOUSEHOLDER INCOME OVER 65 YEARS
98.5/ 100
METRIC RATING
78th/ 347
METRIC RANK
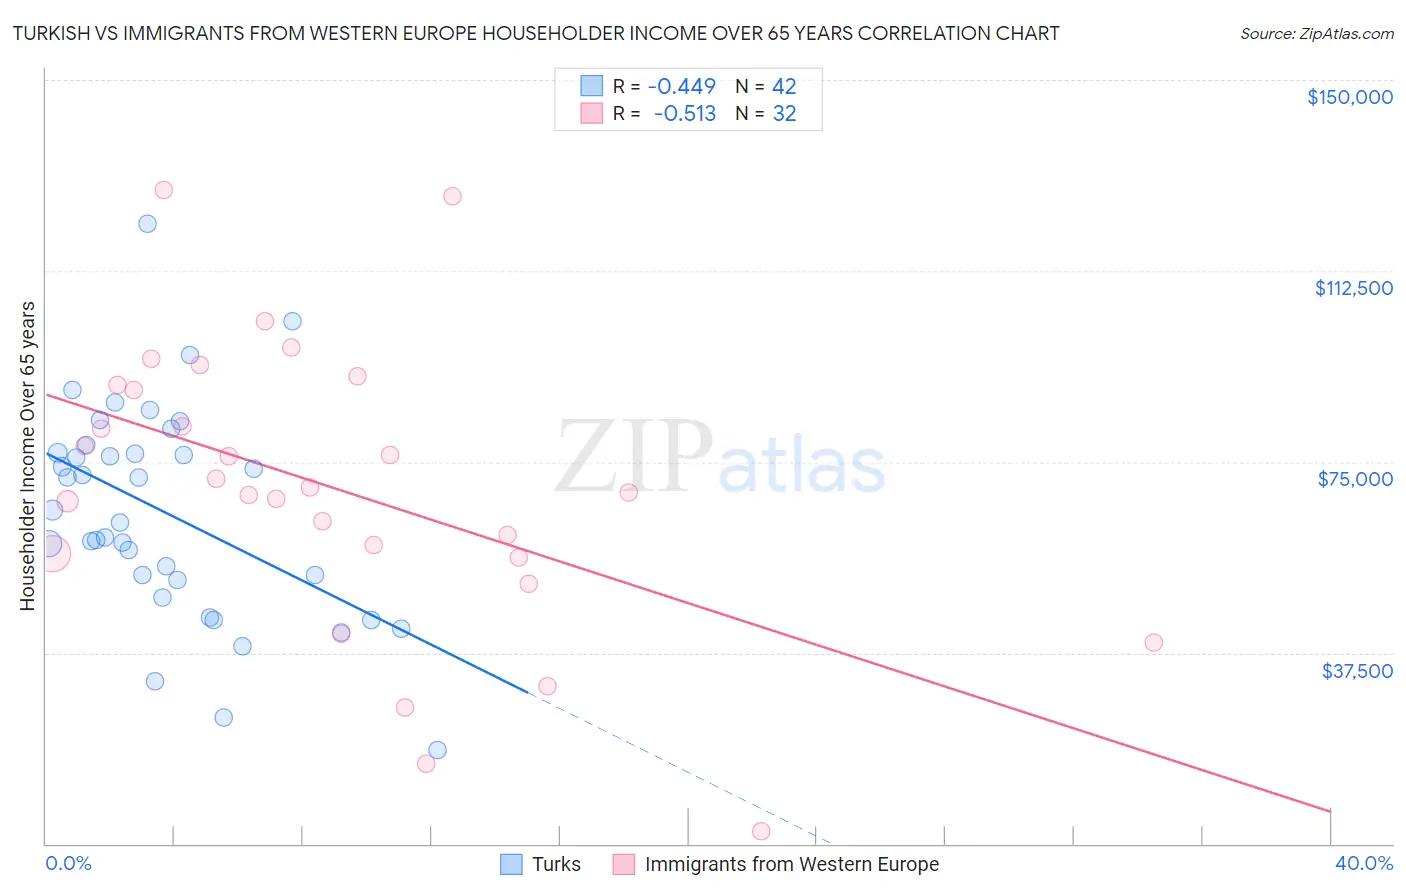
Turkish vs Immigrants from Western Europe Householder Income Over 65 years Correlation Chart
The statistical analysis conducted on geographies consisting of 271,295,449 people shows a moderate negative correlation between the proportion of Turks and household income with householder over the age of 65 in the United States with a correlation coefficient (R) of -0.449 and weighted average of $68,037. Similarly, the statistical analysis conducted on geographies consisting of 491,899,901 people shows a substantial negative correlation between the proportion of Immigrants from Western Europe and household income with householder over the age of 65 in the United States with a correlation coefficient (R) of -0.513 and weighted average of $64,933, a difference of 4.8%.
Householder Income Over 65 years Correlation Summary
| Measurement | Turkish | Immigrants from Western Europe |
| Minimum | $18,472 | $2,499 |
| Maximum | $121,806 | $128,362 |
| Range | $103,334 | $125,863 |
| Mean | $64,935 | $69,616 |
| Median | $64,229 | $69,444 |
| Interquartile 25% (IQ1) | $51,875 | $56,605 |
| Interquartile 75% (IQ3) | $76,840 | $89,563 |
| Interquartile Range (IQR) | $24,964 | $32,958 |
| Standard Deviation (Sample) | $21,025 | $28,415 |
| Standard Deviation (Population) | $20,773 | $27,967 |
Similar Demographics by Householder Income Over 65 years
Demographics Similar to Turks by Householder Income Over 65 years
In terms of householder income over 65 years, the demographic groups most similar to Turks are Estonian ($67,926, a difference of 0.16%), Immigrants from Austria ($68,208, a difference of 0.25%), Tongan ($68,235, a difference of 0.29%), Russian ($67,626, a difference of 0.61%), and Immigrants from Asia ($67,594, a difference of 0.66%).
| Demographics | Rating | Rank | Householder Income Over 65 years |
| Immigrants | Northern Europe | 100.0 /100 | #30 | Exceptional $69,003 |
| Afghans | 100.0 /100 | #31 | Exceptional $68,951 |
| Asians | 100.0 /100 | #32 | Exceptional $68,822 |
| Immigrants | Denmark | 100.0 /100 | #33 | Exceptional $68,801 |
| Immigrants | Ireland | 100.0 /100 | #34 | Exceptional $68,495 |
| Tongans | 100.0 /100 | #35 | Exceptional $68,235 |
| Immigrants | Austria | 99.9 /100 | #36 | Exceptional $68,208 |
| Turks | 99.9 /100 | #37 | Exceptional $68,037 |
| Estonians | 99.9 /100 | #38 | Exceptional $67,926 |
| Russians | 99.9 /100 | #39 | Exceptional $67,626 |
| Immigrants | Asia | 99.9 /100 | #40 | Exceptional $67,594 |
| Koreans | 99.9 /100 | #41 | Exceptional $67,472 |
| New Zealanders | 99.9 /100 | #42 | Exceptional $67,333 |
| Latvians | 99.9 /100 | #43 | Exceptional $67,326 |
| Immigrants | South Africa | 99.9 /100 | #44 | Exceptional $67,234 |
Demographics Similar to Immigrants from Western Europe by Householder Income Over 65 years
In terms of householder income over 65 years, the demographic groups most similar to Immigrants from Western Europe are Hawaiian ($64,920, a difference of 0.020%), Immigrants from Canada ($64,952, a difference of 0.030%), Ethiopian ($64,989, a difference of 0.090%), Immigrants from North America ($64,856, a difference of 0.12%), and Sierra Leonean ($65,038, a difference of 0.16%).
| Demographics | Rating | Rank | Householder Income Over 65 years |
| Greeks | 98.9 /100 | #71 | Exceptional $65,306 |
| Argentineans | 98.9 /100 | #72 | Exceptional $65,246 |
| Immigrants | Ethiopia | 98.9 /100 | #73 | Exceptional $65,238 |
| Lithuanians | 98.8 /100 | #74 | Exceptional $65,209 |
| Sierra Leoneans | 98.6 /100 | #75 | Exceptional $65,038 |
| Ethiopians | 98.5 /100 | #76 | Exceptional $64,989 |
| Immigrants | Canada | 98.5 /100 | #77 | Exceptional $64,952 |
| Immigrants | Western Europe | 98.5 /100 | #78 | Exceptional $64,933 |
| Hawaiians | 98.4 /100 | #79 | Exceptional $64,920 |
| Immigrants | North America | 98.3 /100 | #80 | Exceptional $64,856 |
| Immigrants | Europe | 98.3 /100 | #81 | Exceptional $64,828 |
| Immigrants | Fiji | 98.2 /100 | #82 | Exceptional $64,795 |
| Northern Europeans | 97.9 /100 | #83 | Exceptional $64,658 |
| Immigrants | Greece | 97.9 /100 | #84 | Exceptional $64,636 |
| Immigrants | Lebanon | 97.6 /100 | #85 | Exceptional $64,521 |