Venezuelan vs Immigrants from Sudan Householder Income Over 65 years
COMPARE
Venezuelan
Immigrants from Sudan
Householder Income Over 65 years
Householder Income Over 65 years Comparison
Venezuelans
Immigrants from Sudan
$58,026
HOUSEHOLDER INCOME OVER 65 YEARS
4.4/ 100
METRIC RATING
225th/ 347
METRIC RANK
$59,248
HOUSEHOLDER INCOME OVER 65 YEARS
14.2/ 100
METRIC RATING
205th/ 347
METRIC RANK
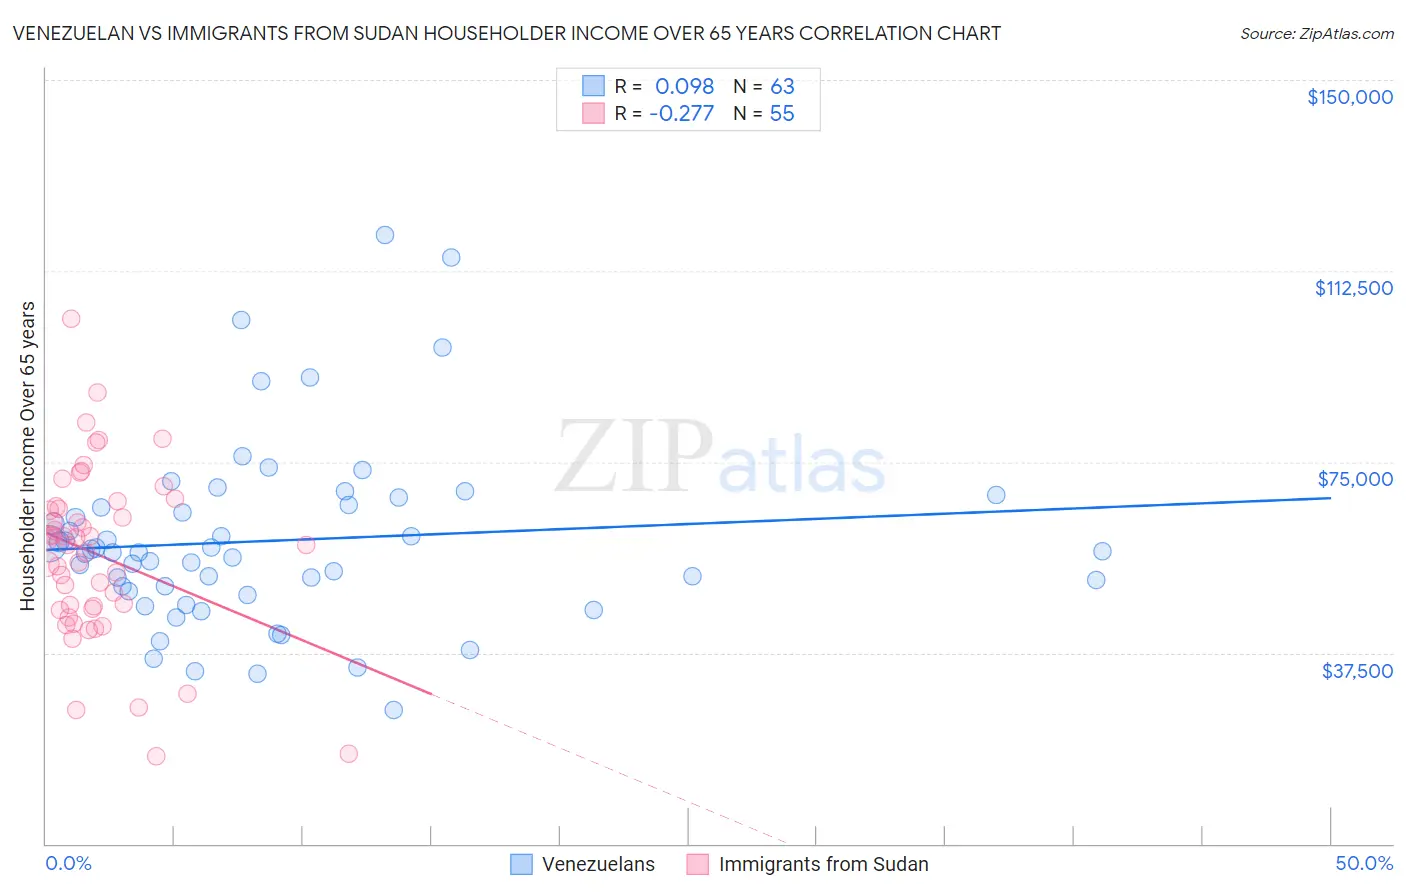
Venezuelan vs Immigrants from Sudan Householder Income Over 65 years Correlation Chart
The statistical analysis conducted on geographies consisting of 305,429,725 people shows a slight positive correlation between the proportion of Venezuelans and household income with householder over the age of 65 in the United States with a correlation coefficient (R) of 0.098 and weighted average of $58,026. Similarly, the statistical analysis conducted on geographies consisting of 118,852,154 people shows a weak negative correlation between the proportion of Immigrants from Sudan and household income with householder over the age of 65 in the United States with a correlation coefficient (R) of -0.277 and weighted average of $59,248, a difference of 2.1%.
Householder Income Over 65 years Correlation Summary
| Measurement | Venezuelan | Immigrants from Sudan |
| Minimum | $26,376 | $17,083 |
| Maximum | $119,643 | $103,228 |
| Range | $93,267 | $86,145 |
| Mean | $59,526 | $56,870 |
| Median | $57,305 | $58,750 |
| Interquartile 25% (IQ1) | $49,696 | $46,141 |
| Interquartile 75% (IQ3) | $66,429 | $66,178 |
| Interquartile Range (IQR) | $16,733 | $20,037 |
| Standard Deviation (Sample) | $18,107 | $16,735 |
| Standard Deviation (Population) | $17,963 | $16,583 |
Demographics Similar to Venezuelans and Immigrants from Sudan by Householder Income Over 65 years
In terms of householder income over 65 years, the demographic groups most similar to Venezuelans are Bermudan ($58,171, a difference of 0.25%), Tsimshian ($58,202, a difference of 0.30%), Delaware ($58,214, a difference of 0.32%), Immigrants from El Salvador ($58,226, a difference of 0.34%), and Yugoslavian ($58,243, a difference of 0.37%). Similarly, the demographic groups most similar to Immigrants from Sudan are Immigrants from South America ($59,151, a difference of 0.16%), Salvadoran ($59,141, a difference of 0.18%), Uruguayan ($59,090, a difference of 0.27%), Slovak ($59,039, a difference of 0.35%), and Nigerian ($58,992, a difference of 0.43%).
| Demographics | Rating | Rank | Householder Income Over 65 years |
| Immigrants | Sudan | 14.2 /100 | #205 | Poor $59,248 |
| Immigrants | South America | 13.0 /100 | #206 | Poor $59,151 |
| Salvadorans | 12.9 /100 | #207 | Poor $59,141 |
| Uruguayans | 12.3 /100 | #208 | Poor $59,090 |
| Slovaks | 11.7 /100 | #209 | Poor $59,039 |
| Nigerians | 11.2 /100 | #210 | Poor $58,992 |
| Immigrants | Nigeria | 10.7 /100 | #211 | Poor $58,942 |
| Colombians | 9.8 /100 | #212 | Tragic $58,851 |
| Whites/Caucasians | 9.8 /100 | #213 | Tragic $58,847 |
| Nepalese | 9.0 /100 | #214 | Tragic $58,761 |
| Immigrants | Ghana | 7.9 /100 | #215 | Tragic $58,624 |
| Immigrants | Middle Africa | 6.2 /100 | #216 | Tragic $58,375 |
| Sudanese | 5.7 /100 | #217 | Tragic $58,281 |
| Panamanians | 5.6 /100 | #218 | Tragic $58,266 |
| Malaysians | 5.5 /100 | #219 | Tragic $58,244 |
| Yugoslavians | 5.5 /100 | #220 | Tragic $58,243 |
| Immigrants | El Salvador | 5.4 /100 | #221 | Tragic $58,226 |
| Delaware | 5.3 /100 | #222 | Tragic $58,214 |
| Tsimshian | 5.2 /100 | #223 | Tragic $58,202 |
| Bermudans | 5.1 /100 | #224 | Tragic $58,171 |
| Venezuelans | 4.4 /100 | #225 | Tragic $58,026 |