Chinese vs Immigrants from Bosnia and Herzegovina Median Earnings
COMPARE
Chinese
Immigrants from Bosnia and Herzegovina
Median Earnings
Median Earnings Comparison
Chinese
Immigrants from Bosnia and Herzegovina
$48,836
MEDIAN EARNINGS
96.7/ 100
METRIC RATING
115th/ 347
METRIC RANK
$45,600
MEDIAN EARNINGS
23.7/ 100
METRIC RATING
208th/ 347
METRIC RANK
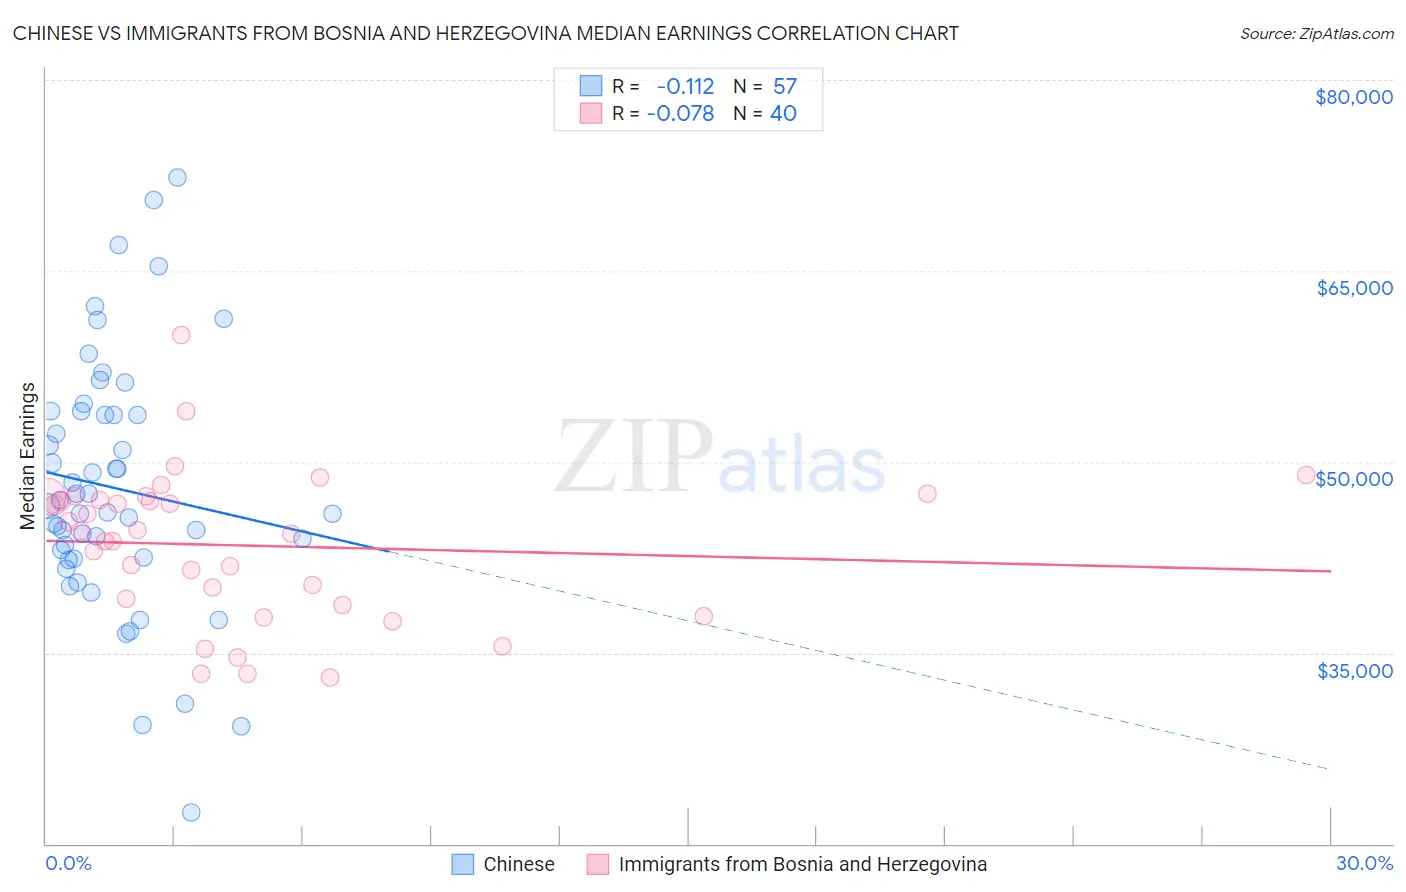
Chinese vs Immigrants from Bosnia and Herzegovina Median Earnings Correlation Chart
The statistical analysis conducted on geographies consisting of 64,808,012 people shows a poor negative correlation between the proportion of Chinese and median earnings in the United States with a correlation coefficient (R) of -0.112 and weighted average of $48,836. Similarly, the statistical analysis conducted on geographies consisting of 156,807,140 people shows a slight negative correlation between the proportion of Immigrants from Bosnia and Herzegovina and median earnings in the United States with a correlation coefficient (R) of -0.078 and weighted average of $45,600, a difference of 7.1%.
Median Earnings Correlation Summary
| Measurement | Chinese | Immigrants from Bosnia and Herzegovina |
| Minimum | $22,468 | $33,044 |
| Maximum | $72,308 | $59,938 |
| Range | $49,840 | $26,894 |
| Mean | $47,945 | $43,428 |
| Median | $46,556 | $44,487 |
| Interquartile 25% (IQ1) | $42,425 | $39,026 |
| Interquartile 75% (IQ3) | $53,869 | $47,127 |
| Interquartile Range (IQR) | $11,444 | $8,100 |
| Standard Deviation (Sample) | $9,906 | $5,836 |
| Standard Deviation (Population) | $9,819 | $5,763 |
Similar Demographics by Median Earnings
Demographics Similar to Chinese by Median Earnings
In terms of median earnings, the demographic groups most similar to Chinese are Moroccan ($48,838, a difference of 0.010%), Immigrants from Kuwait ($48,861, a difference of 0.050%), Northern European ($48,887, a difference of 0.10%), Immigrants from Zimbabwe ($48,913, a difference of 0.16%), and Immigrants from Ethiopia ($48,924, a difference of 0.18%).
| Demographics | Rating | Rank | Median Earnings |
| Palestinians | 98.0 /100 | #108 | Exceptional $49,209 |
| Syrians | 97.1 /100 | #109 | Exceptional $48,934 |
| Immigrants | Ethiopia | 97.1 /100 | #110 | Exceptional $48,924 |
| Immigrants | Zimbabwe | 97.0 /100 | #111 | Exceptional $48,913 |
| Northern Europeans | 96.9 /100 | #112 | Exceptional $48,887 |
| Immigrants | Kuwait | 96.8 /100 | #113 | Exceptional $48,861 |
| Moroccans | 96.7 /100 | #114 | Exceptional $48,838 |
| Chinese | 96.7 /100 | #115 | Exceptional $48,836 |
| Koreans | 96.2 /100 | #116 | Exceptional $48,727 |
| Serbians | 95.9 /100 | #117 | Exceptional $48,677 |
| Immigrants | Jordan | 95.9 /100 | #118 | Exceptional $48,673 |
| Poles | 95.8 /100 | #119 | Exceptional $48,659 |
| Carpatho Rusyns | 95.5 /100 | #120 | Exceptional $48,617 |
| Arabs | 95.4 /100 | #121 | Exceptional $48,599 |
| Chileans | 94.8 /100 | #122 | Exceptional $48,504 |
Demographics Similar to Immigrants from Bosnia and Herzegovina by Median Earnings
In terms of median earnings, the demographic groups most similar to Immigrants from Bosnia and Herzegovina are Immigrants from Thailand ($45,598, a difference of 0.0%), Immigrants from Grenada ($45,596, a difference of 0.010%), Panamanian ($45,593, a difference of 0.010%), Bermudan ($45,593, a difference of 0.010%), and Immigrants from Senegal ($45,611, a difference of 0.020%).
| Demographics | Rating | Rank | Median Earnings |
| Celtics | 27.2 /100 | #201 | Fair $45,732 |
| Immigrants | Trinidad and Tobago | 27.1 /100 | #202 | Fair $45,729 |
| Welsh | 26.6 /100 | #203 | Fair $45,710 |
| Immigrants | Uruguay | 25.9 /100 | #204 | Fair $45,682 |
| Tongans | 25.4 /100 | #205 | Fair $45,665 |
| Immigrants | Ghana | 24.8 /100 | #206 | Fair $45,641 |
| Immigrants | Senegal | 24.0 /100 | #207 | Fair $45,611 |
| Immigrants | Bosnia and Herzegovina | 23.7 /100 | #208 | Fair $45,600 |
| Immigrants | Thailand | 23.7 /100 | #209 | Fair $45,598 |
| Immigrants | Grenada | 23.6 /100 | #210 | Fair $45,596 |
| Panamanians | 23.5 /100 | #211 | Fair $45,593 |
| Bermudans | 23.5 /100 | #212 | Fair $45,593 |
| Immigrants | Colombia | 22.4 /100 | #213 | Fair $45,550 |
| Nigerians | 22.0 /100 | #214 | Fair $45,532 |
| Immigrants | Bangladesh | 22.0 /100 | #215 | Fair $45,532 |