Central American Indian vs Bermudan Median Female Earnings
COMPARE
Central American Indian
Bermudan
Median Female Earnings
Median Female Earnings Comparison
Central American Indians
Bermudans
$35,930
MEDIAN FEMALE EARNINGS
0.0/ 100
METRIC RATING
290th/ 347
METRIC RANK
$39,418
MEDIAN FEMALE EARNINGS
35.9/ 100
METRIC RATING
188th/ 347
METRIC RANK
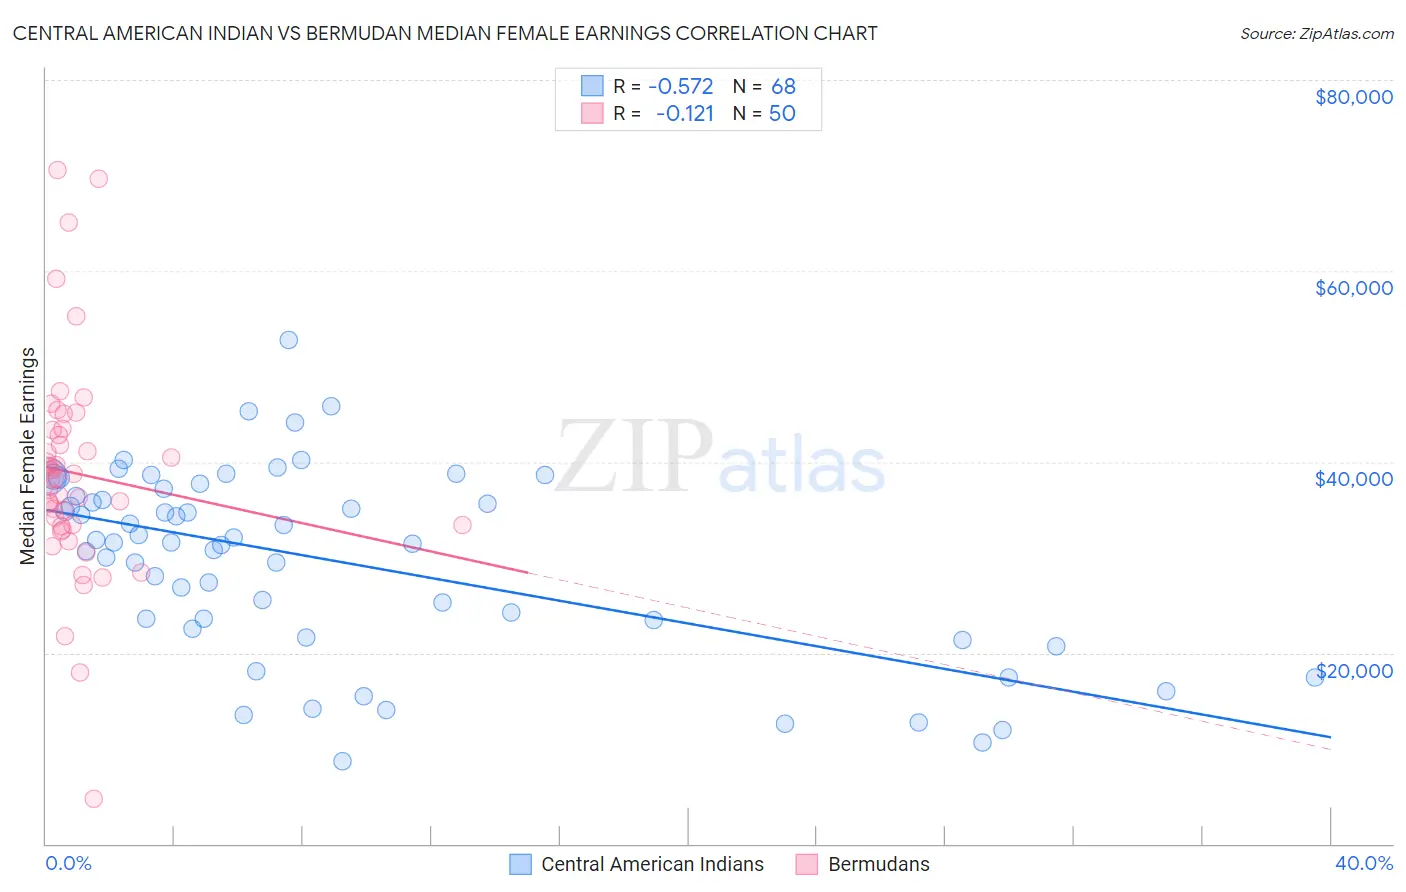
Central American Indian vs Bermudan Median Female Earnings Correlation Chart
The statistical analysis conducted on geographies consisting of 326,049,316 people shows a substantial negative correlation between the proportion of Central American Indians and median female earnings in the United States with a correlation coefficient (R) of -0.572 and weighted average of $35,930. Similarly, the statistical analysis conducted on geographies consisting of 55,724,642 people shows a poor negative correlation between the proportion of Bermudans and median female earnings in the United States with a correlation coefficient (R) of -0.121 and weighted average of $39,418, a difference of 9.7%.
Median Female Earnings Correlation Summary
| Measurement | Central American Indian | Bermudan |
| Minimum | $8,640 | $4,682 |
| Maximum | $52,708 | $70,590 |
| Range | $44,068 | $65,908 |
| Mean | $29,634 | $38,764 |
| Median | $31,554 | $38,256 |
| Interquartile 25% (IQ1) | $22,964 | $33,240 |
| Interquartile 75% (IQ3) | $36,801 | $43,282 |
| Interquartile Range (IQR) | $13,837 | $10,042 |
| Standard Deviation (Sample) | $9,825 | $11,556 |
| Standard Deviation (Population) | $9,752 | $11,440 |
Similar Demographics by Median Female Earnings
Demographics Similar to Central American Indians by Median Female Earnings
In terms of median female earnings, the demographic groups most similar to Central American Indians are Bangladeshi ($35,960, a difference of 0.080%), Blackfeet ($35,864, a difference of 0.18%), Immigrants from Zaire ($36,017, a difference of 0.24%), Immigrants from Nicaragua ($36,023, a difference of 0.26%), and Osage ($36,034, a difference of 0.29%).
| Demographics | Rating | Rank | Median Female Earnings |
| Immigrants | Haiti | 0.1 /100 | #283 | Tragic $36,203 |
| Indonesians | 0.1 /100 | #284 | Tragic $36,140 |
| Paiute | 0.1 /100 | #285 | Tragic $36,056 |
| Osage | 0.0 /100 | #286 | Tragic $36,034 |
| Immigrants | Nicaragua | 0.0 /100 | #287 | Tragic $36,023 |
| Immigrants | Zaire | 0.0 /100 | #288 | Tragic $36,017 |
| Bangladeshis | 0.0 /100 | #289 | Tragic $35,960 |
| Central American Indians | 0.0 /100 | #290 | Tragic $35,930 |
| Blackfeet | 0.0 /100 | #291 | Tragic $35,864 |
| Americans | 0.0 /100 | #292 | Tragic $35,777 |
| Guatemalans | 0.0 /100 | #293 | Tragic $35,695 |
| Cheyenne | 0.0 /100 | #294 | Tragic $35,673 |
| Comanche | 0.0 /100 | #295 | Tragic $35,661 |
| Mexican American Indians | 0.0 /100 | #296 | Tragic $35,629 |
| Hmong | 0.0 /100 | #297 | Tragic $35,498 |
Demographics Similar to Bermudans by Median Female Earnings
In terms of median female earnings, the demographic groups most similar to Bermudans are Swedish ($39,421, a difference of 0.010%), Colombian ($39,439, a difference of 0.050%), Immigrants from West Indies ($39,441, a difference of 0.060%), Senegalese ($39,384, a difference of 0.090%), and European ($39,457, a difference of 0.10%).
| Demographics | Rating | Rank | Median Female Earnings |
| Tsimshian | 41.4 /100 | #181 | Average $39,530 |
| Tlingit-Haida | 40.5 /100 | #182 | Average $39,513 |
| Hungarians | 40.3 /100 | #183 | Average $39,510 |
| Europeans | 37.7 /100 | #184 | Fair $39,457 |
| Immigrants | West Indies | 36.9 /100 | #185 | Fair $39,441 |
| Colombians | 36.9 /100 | #186 | Fair $39,439 |
| Swedes | 36.0 /100 | #187 | Fair $39,421 |
| Bermudans | 35.9 /100 | #188 | Fair $39,418 |
| Senegalese | 34.2 /100 | #189 | Fair $39,384 |
| Puget Sound Salish | 33.9 /100 | #190 | Fair $39,376 |
| Immigrants | Western Africa | 32.7 /100 | #191 | Fair $39,351 |
| Immigrants | Immigrants | 31.7 /100 | #192 | Fair $39,328 |
| Immigrants | Nigeria | 30.2 /100 | #193 | Fair $39,294 |
| Irish | 30.0 /100 | #194 | Fair $39,291 |
| Uruguayans | 27.3 /100 | #195 | Fair $39,228 |