Tsimshian vs Immigrants from Czechoslovakia Median Household Income
COMPARE
Tsimshian
Immigrants from Czechoslovakia
Median Household Income
Median Household Income Comparison
Tsimshian
Immigrants from Czechoslovakia
$83,346
MEDIAN HOUSEHOLD INCOME
24.5/ 100
METRIC RATING
200th/ 347
METRIC RANK
$95,319
MEDIAN HOUSEHOLD INCOME
99.9/ 100
METRIC RATING
55th/ 347
METRIC RANK
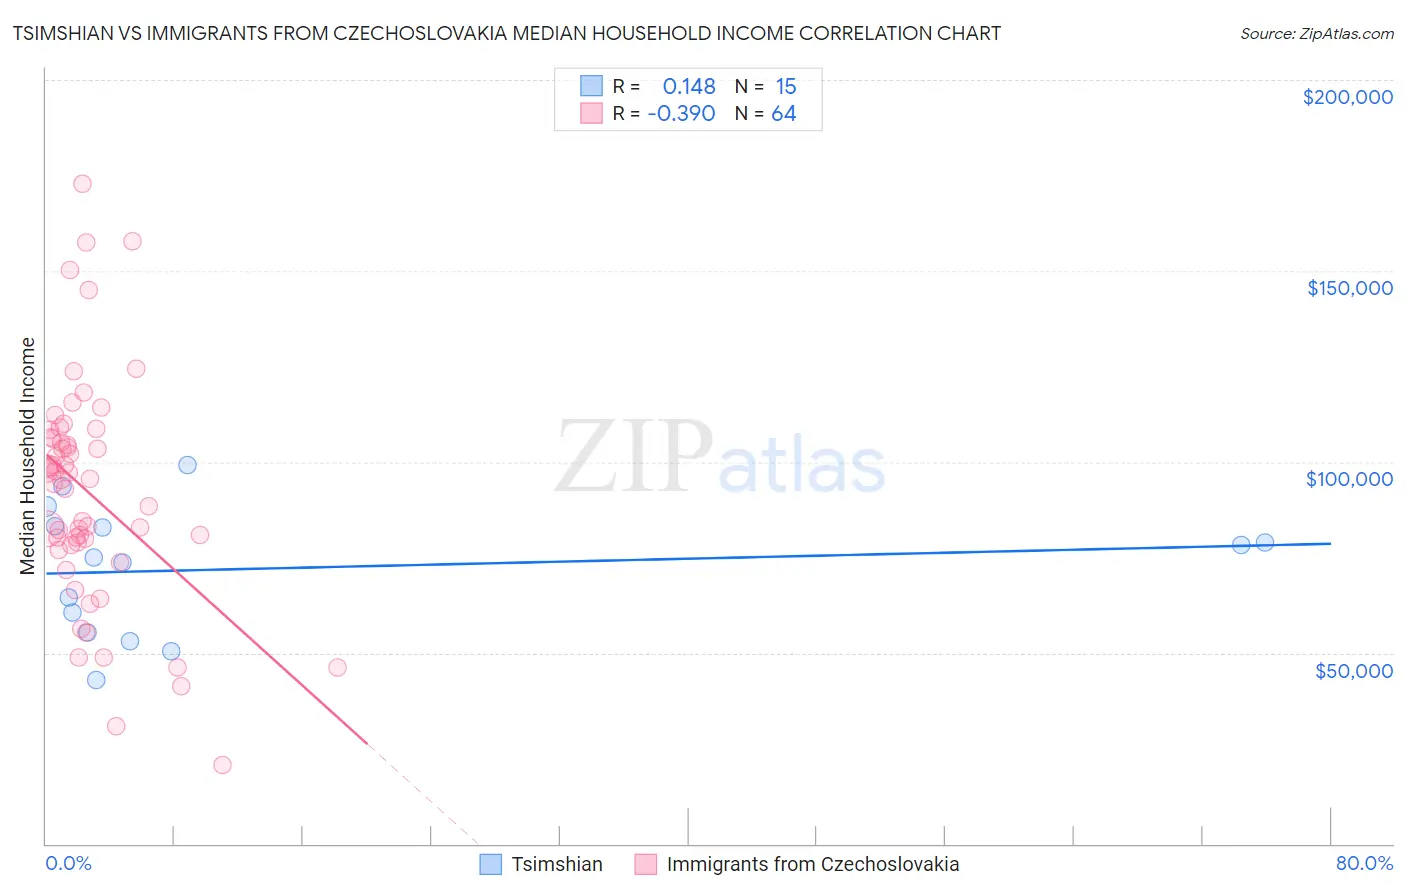
Tsimshian vs Immigrants from Czechoslovakia Median Household Income Correlation Chart
The statistical analysis conducted on geographies consisting of 15,626,462 people shows a poor positive correlation between the proportion of Tsimshian and median household income in the United States with a correlation coefficient (R) of 0.148 and weighted average of $83,346. Similarly, the statistical analysis conducted on geographies consisting of 195,443,038 people shows a mild negative correlation between the proportion of Immigrants from Czechoslovakia and median household income in the United States with a correlation coefficient (R) of -0.390 and weighted average of $95,319, a difference of 14.4%.
Median Household Income Correlation Summary
| Measurement | Tsimshian | Immigrants from Czechoslovakia |
| Minimum | $42,857 | $20,761 |
| Maximum | $99,167 | $172,802 |
| Range | $56,310 | $152,041 |
| Mean | $71,994 | $91,959 |
| Median | $75,000 | $95,339 |
| Interquartile 25% (IQ1) | $55,448 | $78,538 |
| Interquartile 75% (IQ3) | $83,217 | $106,288 |
| Interquartile Range (IQR) | $27,769 | $27,750 |
| Standard Deviation (Sample) | $16,777 | $29,573 |
| Standard Deviation (Population) | $16,208 | $29,341 |
Similar Demographics by Median Household Income
Demographics Similar to Tsimshian by Median Household Income
In terms of median household income, the demographic groups most similar to Tsimshian are Spanish ($83,343, a difference of 0.0%), German ($83,358, a difference of 0.010%), Immigrants from Thailand ($83,327, a difference of 0.020%), Immigrants from Cambodia ($83,304, a difference of 0.050%), and Japanese ($83,395, a difference of 0.060%).
| Demographics | Rating | Rank | Median Household Income |
| Finns | 27.7 /100 | #193 | Fair $83,607 |
| Ghanaians | 27.4 /100 | #194 | Fair $83,582 |
| Immigrants | Armenia | 27.0 /100 | #195 | Fair $83,555 |
| French | 26.0 /100 | #196 | Fair $83,468 |
| Aleuts | 25.7 /100 | #197 | Fair $83,446 |
| Japanese | 25.1 /100 | #198 | Fair $83,395 |
| Germans | 24.6 /100 | #199 | Fair $83,358 |
| Tsimshian | 24.5 /100 | #200 | Fair $83,346 |
| Spanish | 24.4 /100 | #201 | Fair $83,343 |
| Immigrants | Thailand | 24.3 /100 | #202 | Fair $83,327 |
| Immigrants | Cambodia | 24.0 /100 | #203 | Fair $83,304 |
| Immigrants | Africa | 23.8 /100 | #204 | Fair $83,289 |
| Celtics | 22.7 /100 | #205 | Fair $83,193 |
| Immigrants | Kenya | 21.3 /100 | #206 | Fair $83,068 |
| Dutch | 20.3 /100 | #207 | Fair $82,971 |
Demographics Similar to Immigrants from Czechoslovakia by Median Household Income
In terms of median household income, the demographic groups most similar to Immigrants from Czechoslovakia are Immigrants from Austria ($95,277, a difference of 0.040%), New Zealander ($95,146, a difference of 0.18%), Soviet Union ($95,098, a difference of 0.23%), Immigrants from Europe ($95,032, a difference of 0.30%), and Korean ($95,018, a difference of 0.32%).
| Demographics | Rating | Rank | Median Household Income |
| Cambodians | 99.9 /100 | #48 | Exceptional $96,324 |
| Immigrants | Malaysia | 99.9 /100 | #49 | Exceptional $96,292 |
| Bulgarians | 99.9 /100 | #50 | Exceptional $96,290 |
| Estonians | 99.9 /100 | #51 | Exceptional $95,930 |
| Immigrants | South Africa | 99.9 /100 | #52 | Exceptional $95,800 |
| Paraguayans | 99.9 /100 | #53 | Exceptional $95,737 |
| Egyptians | 99.9 /100 | #54 | Exceptional $95,673 |
| Immigrants | Czechoslovakia | 99.9 /100 | #55 | Exceptional $95,319 |
| Immigrants | Austria | 99.9 /100 | #56 | Exceptional $95,277 |
| New Zealanders | 99.8 /100 | #57 | Exceptional $95,146 |
| Soviet Union | 99.8 /100 | #58 | Exceptional $95,098 |
| Immigrants | Europe | 99.8 /100 | #59 | Exceptional $95,032 |
| Koreans | 99.8 /100 | #60 | Exceptional $95,018 |
| Laotians | 99.8 /100 | #61 | Exceptional $94,990 |
| Immigrants | Norway | 99.8 /100 | #62 | Exceptional $94,846 |