Immigrants from Norway vs Swedish Median Earnings
COMPARE
Immigrants from Norway
Swedish
Median Earnings
Median Earnings Comparison
Immigrants from Norway
Swedes
$51,758
MEDIAN EARNINGS
99.9/ 100
METRIC RATING
53rd/ 347
METRIC RANK
$47,851
MEDIAN EARNINGS
88.0/ 100
METRIC RATING
143rd/ 347
METRIC RANK
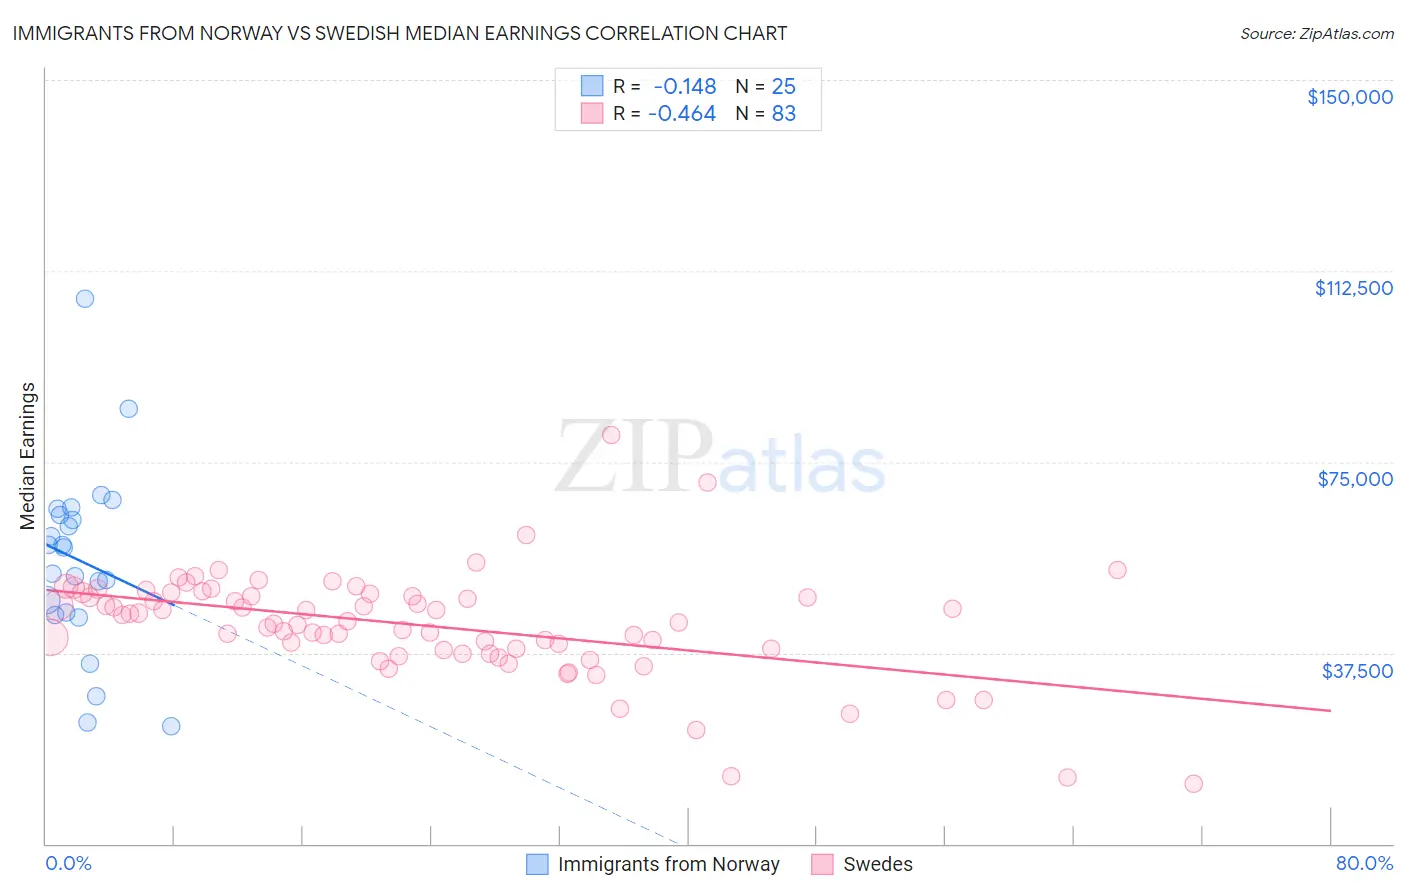
Immigrants from Norway vs Swedish Median Earnings Correlation Chart
The statistical analysis conducted on geographies consisting of 116,707,889 people shows a poor negative correlation between the proportion of Immigrants from Norway and median earnings in the United States with a correlation coefficient (R) of -0.148 and weighted average of $51,758. Similarly, the statistical analysis conducted on geographies consisting of 538,996,314 people shows a moderate negative correlation between the proportion of Swedes and median earnings in the United States with a correlation coefficient (R) of -0.464 and weighted average of $47,851, a difference of 8.2%.
Median Earnings Correlation Summary
| Measurement | Immigrants from Norway | Swedish |
| Minimum | $23,125 | $11,875 |
| Maximum | $106,979 | $80,254 |
| Range | $83,854 | $68,379 |
| Mean | $55,577 | $42,935 |
| Median | $58,159 | $43,757 |
| Interquartile 25% (IQ1) | $45,162 | $37,994 |
| Interquartile 75% (IQ3) | $65,163 | $49,030 |
| Interquartile Range (IQR) | $20,000 | $11,035 |
| Standard Deviation (Sample) | $18,163 | $10,532 |
| Standard Deviation (Population) | $17,796 | $10,468 |
Similar Demographics by Median Earnings
Demographics Similar to Immigrants from Norway by Median Earnings
In terms of median earnings, the demographic groups most similar to Immigrants from Norway are Estonian ($51,772, a difference of 0.030%), Immigrants from Indonesia ($51,715, a difference of 0.080%), Egyptian ($51,701, a difference of 0.11%), Immigrants from Austria ($51,826, a difference of 0.13%), and Immigrants from Pakistan ($51,693, a difference of 0.13%).
| Demographics | Rating | Rank | Median Earnings |
| Bhutanese | 100.0 /100 | #46 | Exceptional $52,297 |
| Australians | 100.0 /100 | #47 | Exceptional $52,294 |
| Immigrants | Europe | 100.0 /100 | #48 | Exceptional $52,195 |
| Bolivians | 100.0 /100 | #49 | Exceptional $52,005 |
| Immigrants | South Africa | 100.0 /100 | #50 | Exceptional $51,850 |
| Immigrants | Austria | 99.9 /100 | #51 | Exceptional $51,826 |
| Estonians | 99.9 /100 | #52 | Exceptional $51,772 |
| Immigrants | Norway | 99.9 /100 | #53 | Exceptional $51,758 |
| Immigrants | Indonesia | 99.9 /100 | #54 | Exceptional $51,715 |
| Egyptians | 99.9 /100 | #55 | Exceptional $51,701 |
| Immigrants | Pakistan | 99.9 /100 | #56 | Exceptional $51,693 |
| Immigrants | Eastern Europe | 99.9 /100 | #57 | Exceptional $51,624 |
| Immigrants | Bolivia | 99.9 /100 | #58 | Exceptional $51,605 |
| Immigrants | Croatia | 99.9 /100 | #59 | Exceptional $51,581 |
| Immigrants | Serbia | 99.9 /100 | #60 | Exceptional $51,557 |
Demographics Similar to Swedes by Median Earnings
In terms of median earnings, the demographic groups most similar to Swedes are Ugandan ($47,854, a difference of 0.010%), Immigrants from Sierra Leone ($47,875, a difference of 0.050%), Taiwanese ($47,902, a difference of 0.11%), Hungarian ($47,795, a difference of 0.12%), and European ($47,915, a difference of 0.13%).
| Demographics | Rating | Rank | Median Earnings |
| Slovenes | 90.0 /100 | #136 | Excellent $47,995 |
| Immigrants | Nepal | 89.0 /100 | #137 | Excellent $47,925 |
| Europeans | 88.9 /100 | #138 | Excellent $47,915 |
| Canadians | 88.8 /100 | #139 | Excellent $47,911 |
| Taiwanese | 88.7 /100 | #140 | Excellent $47,902 |
| Immigrants | Sierra Leone | 88.3 /100 | #141 | Excellent $47,875 |
| Ugandans | 88.0 /100 | #142 | Excellent $47,854 |
| Swedes | 88.0 /100 | #143 | Excellent $47,851 |
| Hungarians | 87.1 /100 | #144 | Excellent $47,795 |
| Immigrants | Saudi Arabia | 85.6 /100 | #145 | Excellent $47,704 |
| Immigrants | Chile | 85.5 /100 | #146 | Excellent $47,697 |
| Immigrants | South Eastern Asia | 85.0 /100 | #147 | Excellent $47,671 |
| Immigrants | Eritrea | 84.8 /100 | #148 | Excellent $47,657 |
| Luxembourgers | 84.5 /100 | #149 | Excellent $47,640 |
| Peruvians | 84.2 /100 | #150 | Excellent $47,628 |