Trinidadian and Tobagonian vs Immigrants from Trinidad and Tobago Child Poverty Among Boys Under 16
COMPARE
Trinidadian and Tobagonian
Immigrants from Trinidad and Tobago
Child Poverty Among Boys Under 16
Child Poverty Among Boys Under 16 Comparison
Trinidadians and Tobagonians
Immigrants from Trinidad and Tobago
19.3%
CHILD POVERTY AMONG BOYS UNDER 16
0.2/ 100
METRIC RATING
254th/ 347
METRIC RANK
19.0%
CHILD POVERTY AMONG BOYS UNDER 16
0.3/ 100
METRIC RATING
247th/ 347
METRIC RANK
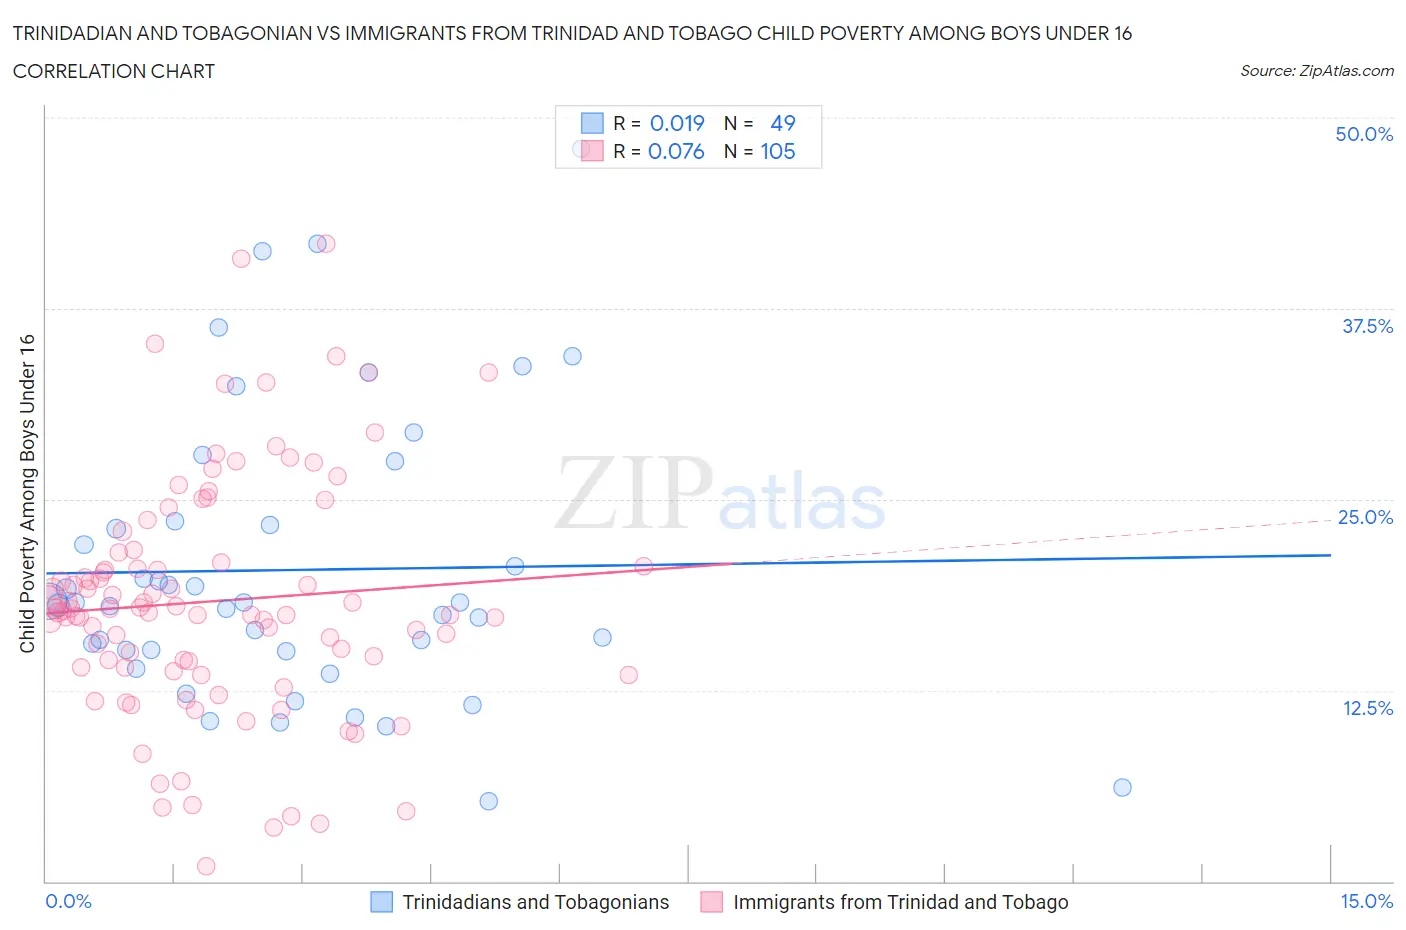
Trinidadian and Tobagonian vs Immigrants from Trinidad and Tobago Child Poverty Among Boys Under 16 Correlation Chart
The statistical analysis conducted on geographies consisting of 217,984,021 people shows no correlation between the proportion of Trinidadians and Tobagonians and poverty level among boys under the age of 16 in the United States with a correlation coefficient (R) of 0.019 and weighted average of 19.3%. Similarly, the statistical analysis conducted on geographies consisting of 221,543,811 people shows a slight positive correlation between the proportion of Immigrants from Trinidad and Tobago and poverty level among boys under the age of 16 in the United States with a correlation coefficient (R) of 0.076 and weighted average of 19.0%, a difference of 1.5%.
Child Poverty Among Boys Under 16 Correlation Summary
| Measurement | Trinidadian and Tobagonian | Immigrants from Trinidad and Tobago |
| Minimum | 5.3% | 0.94% |
| Maximum | 48.0% | 41.7% |
| Range | 42.7% | 40.8% |
| Mean | 20.4% | 18.3% |
| Median | 18.2% | 17.7% |
| Interquartile 25% (IQ1) | 15.1% | 14.0% |
| Interquartile 75% (IQ3) | 23.4% | 21.2% |
| Interquartile Range (IQR) | 8.4% | 7.2% |
| Standard Deviation (Sample) | 9.3% | 7.8% |
| Standard Deviation (Population) | 9.2% | 7.7% |
Demographics Similar to Trinidadians and Tobagonians and Immigrants from Trinidad and Tobago by Child Poverty Among Boys Under 16
In terms of child poverty among boys under 16, the demographic groups most similar to Trinidadians and Tobagonians are Ecuadorian (19.3%, a difference of 0.0%), Immigrants from Liberia (19.3%, a difference of 0.030%), Mexican American Indian (19.4%, a difference of 0.24%), Potawatomi (19.4%, a difference of 0.25%), and Liberian (19.3%, a difference of 0.27%). Similarly, the demographic groups most similar to Immigrants from Trinidad and Tobago are Salvadoran (19.0%, a difference of 0.080%), Immigrants from Nicaragua (19.0%, a difference of 0.12%), Alsatian (19.1%, a difference of 0.25%), Cree (19.0%, a difference of 0.32%), and Immigrants from Middle Africa (18.9%, a difference of 0.45%).
| Demographics | Rating | Rank | Child Poverty Among Boys Under 16 |
| Immigrants | Cuba | 0.6 /100 | #240 | Tragic 18.8% |
| Immigrants | Sudan | 0.6 /100 | #241 | Tragic 18.8% |
| Ghanaians | 0.5 /100 | #242 | Tragic 18.9% |
| Immigrants | Azores | 0.4 /100 | #243 | Tragic 18.9% |
| Immigrants | Middle Africa | 0.4 /100 | #244 | Tragic 18.9% |
| Cree | 0.4 /100 | #245 | Tragic 19.0% |
| Immigrants | Nicaragua | 0.4 /100 | #246 | Tragic 19.0% |
| Immigrants | Trinidad and Tobago | 0.3 /100 | #247 | Tragic 19.0% |
| Salvadorans | 0.3 /100 | #248 | Tragic 19.0% |
| Alsatians | 0.3 /100 | #249 | Tragic 19.1% |
| Immigrants | Burma/Myanmar | 0.2 /100 | #250 | Tragic 19.2% |
| French American Indians | 0.2 /100 | #251 | Tragic 19.2% |
| Immigrants | Western Africa | 0.2 /100 | #252 | Tragic 19.3% |
| Liberians | 0.2 /100 | #253 | Tragic 19.3% |
| Trinidadians and Tobagonians | 0.2 /100 | #254 | Tragic 19.3% |
| Ecuadorians | 0.2 /100 | #255 | Tragic 19.3% |
| Immigrants | Liberia | 0.2 /100 | #256 | Tragic 19.3% |
| Mexican American Indians | 0.2 /100 | #257 | Tragic 19.4% |
| Potawatomi | 0.2 /100 | #258 | Tragic 19.4% |
| Spanish Americans | 0.2 /100 | #259 | Tragic 19.4% |
| Shoshone | 0.2 /100 | #260 | Tragic 19.4% |