Trinidadian and Tobagonian vs Houma Median Household Income
COMPARE
Trinidadian and Tobagonian
Houma
Median Household Income
Median Household Income Comparison
Trinidadians and Tobagonians
Houma
$80,402
MEDIAN HOUSEHOLD INCOME
4.7/ 100
METRIC RATING
231st/ 347
METRIC RANK
$62,575
MEDIAN HOUSEHOLD INCOME
0.0/ 100
METRIC RATING
343rd/ 347
METRIC RANK
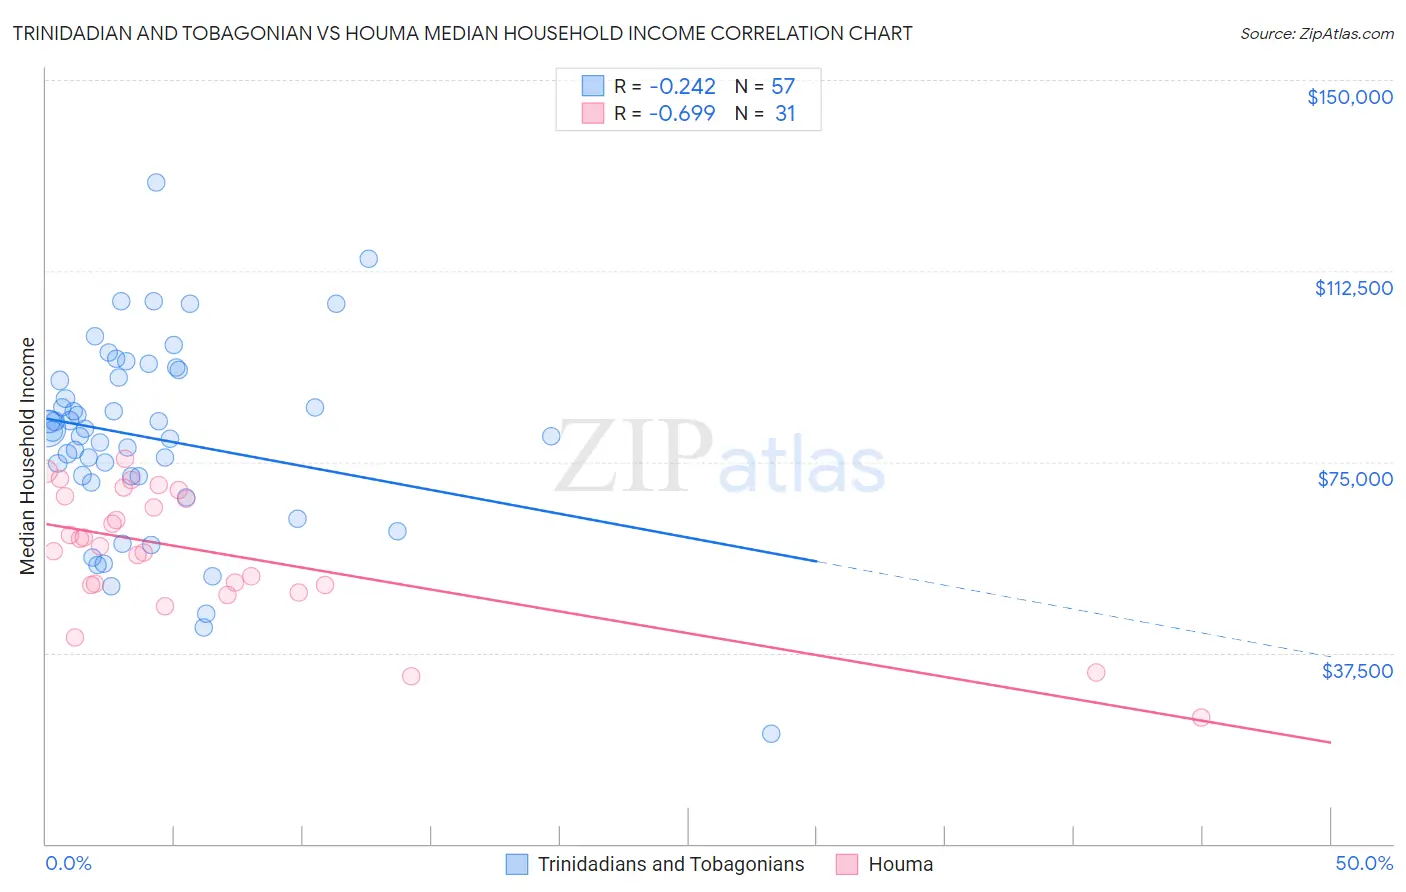
Trinidadian and Tobagonian vs Houma Median Household Income Correlation Chart
The statistical analysis conducted on geographies consisting of 219,662,857 people shows a weak negative correlation between the proportion of Trinidadians and Tobagonians and median household income in the United States with a correlation coefficient (R) of -0.242 and weighted average of $80,402. Similarly, the statistical analysis conducted on geographies consisting of 36,792,126 people shows a significant negative correlation between the proportion of Houma and median household income in the United States with a correlation coefficient (R) of -0.699 and weighted average of $62,575, a difference of 28.5%.
Median Household Income Correlation Summary
| Measurement | Trinidadian and Tobagonian | Houma |
| Minimum | $21,629 | $24,706 |
| Maximum | $129,829 | $75,521 |
| Range | $108,200 | $50,815 |
| Mean | $79,550 | $57,222 |
| Median | $80,957 | $58,380 |
| Interquartile 25% (IQ1) | $71,474 | $50,766 |
| Interquartile 75% (IQ3) | $92,337 | $68,165 |
| Interquartile Range (IQR) | $20,862 | $17,398 |
| Standard Deviation (Sample) | $19,105 | $12,629 |
| Standard Deviation (Population) | $18,937 | $12,424 |
Similar Demographics by Median Household Income
Demographics Similar to Trinidadians and Tobagonians by Median Household Income
In terms of median household income, the demographic groups most similar to Trinidadians and Tobagonians are Bermudan ($80,406, a difference of 0.010%), Immigrants from Trinidad and Tobago ($80,373, a difference of 0.040%), Immigrants from the Azores ($80,357, a difference of 0.060%), Immigrants from Ecuador ($80,341, a difference of 0.080%), and Immigrants from Guyana ($80,324, a difference of 0.10%).
| Demographics | Rating | Rank | Median Household Income |
| Malaysians | 7.0 /100 | #224 | Tragic $81,064 |
| Scotch-Irish | 6.6 /100 | #225 | Tragic $80,972 |
| Immigrants | Panama | 6.2 /100 | #226 | Tragic $80,873 |
| Guyanese | 5.7 /100 | #227 | Tragic $80,734 |
| Immigrants | Bangladesh | 5.7 /100 | #228 | Tragic $80,722 |
| Delaware | 5.0 /100 | #229 | Tragic $80,527 |
| Bermudans | 4.7 /100 | #230 | Tragic $80,406 |
| Trinidadians and Tobagonians | 4.7 /100 | #231 | Tragic $80,402 |
| Immigrants | Trinidad and Tobago | 4.6 /100 | #232 | Tragic $80,373 |
| Immigrants | Azores | 4.5 /100 | #233 | Tragic $80,357 |
| Immigrants | Ecuador | 4.5 /100 | #234 | Tragic $80,341 |
| Immigrants | Guyana | 4.5 /100 | #235 | Tragic $80,324 |
| Immigrants | Bosnia and Herzegovina | 3.4 /100 | #236 | Tragic $79,888 |
| Nicaraguans | 3.1 /100 | #237 | Tragic $79,737 |
| Barbadians | 3.0 /100 | #238 | Tragic $79,664 |
Demographics Similar to Houma by Median Household Income
In terms of median household income, the demographic groups most similar to Houma are Pima ($63,262, a difference of 1.1%), Tohono O'odham ($61,663, a difference of 1.5%), Crow ($63,681, a difference of 1.8%), Pueblo ($64,692, a difference of 3.4%), and Hopi ($65,043, a difference of 3.9%).
| Demographics | Rating | Rank | Median Household Income |
| Creek | 0.0 /100 | #333 | Tragic $67,715 |
| Blacks/African Americans | 0.0 /100 | #334 | Tragic $67,573 |
| Cheyenne | 0.0 /100 | #335 | Tragic $66,974 |
| Immigrants | Congo | 0.0 /100 | #336 | Tragic $66,768 |
| Kiowa | 0.0 /100 | #337 | Tragic $65,914 |
| Immigrants | Yemen | 0.0 /100 | #338 | Tragic $65,194 |
| Hopi | 0.0 /100 | #339 | Tragic $65,043 |
| Pueblo | 0.0 /100 | #340 | Tragic $64,692 |
| Crow | 0.0 /100 | #341 | Tragic $63,681 |
| Pima | 0.0 /100 | #342 | Tragic $63,262 |
| Houma | 0.0 /100 | #343 | Tragic $62,575 |
| Tohono O'odham | 0.0 /100 | #344 | Tragic $61,663 |
| Puerto Ricans | 0.0 /100 | #345 | Tragic $59,197 |
| Navajo | 0.0 /100 | #346 | Tragic $59,159 |
| Lumbee | 0.0 /100 | #347 | Tragic $54,644 |