Tongan vs Immigrants from France Median Household Income
COMPARE
Tongan
Immigrants from France
Median Household Income
Median Household Income Comparison
Tongans
Immigrants from France
$93,076
MEDIAN HOUSEHOLD INCOME
99.4/ 100
METRIC RATING
80th/ 347
METRIC RANK
$96,743
MEDIAN HOUSEHOLD INCOME
99.9/ 100
METRIC RATING
43rd/ 347
METRIC RANK
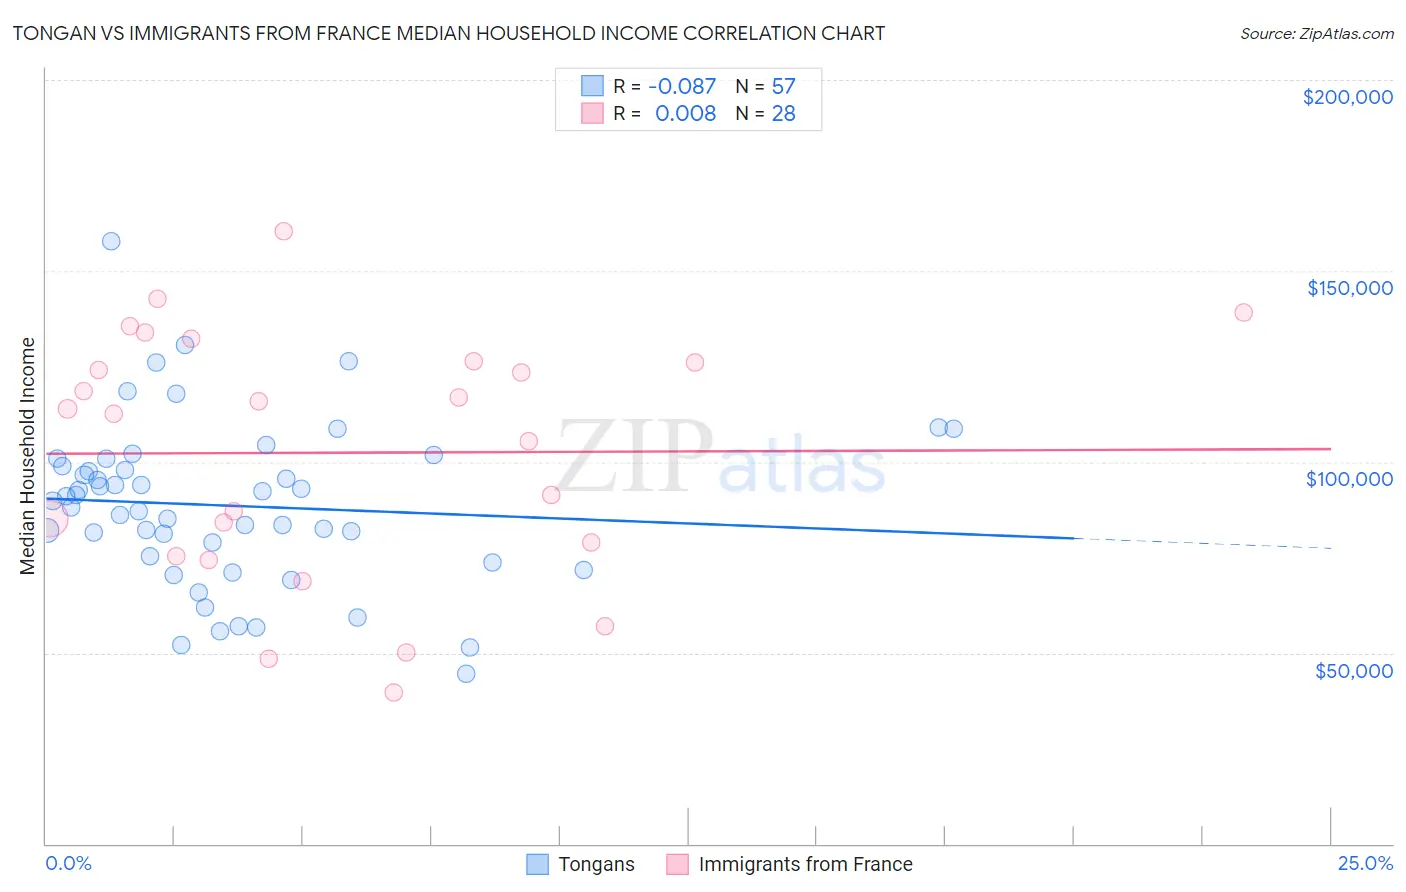
Tongan vs Immigrants from France Median Household Income Correlation Chart
The statistical analysis conducted on geographies consisting of 102,857,692 people shows a slight negative correlation between the proportion of Tongans and median household income in the United States with a correlation coefficient (R) of -0.087 and weighted average of $93,076. Similarly, the statistical analysis conducted on geographies consisting of 287,829,118 people shows no correlation between the proportion of Immigrants from France and median household income in the United States with a correlation coefficient (R) of 0.008 and weighted average of $96,743, a difference of 3.9%.
Median Household Income Correlation Summary
| Measurement | Tongan | Immigrants from France |
| Minimum | $44,375 | $39,667 |
| Maximum | $157,875 | $160,542 |
| Range | $113,500 | $120,875 |
| Mean | $88,526 | $102,392 |
| Median | $89,840 | $113,241 |
| Interquartile 25% (IQ1) | $74,550 | $77,070 |
| Interquartile 75% (IQ3) | $99,865 | $126,188 |
| Interquartile Range (IQR) | $25,315 | $49,118 |
| Standard Deviation (Sample) | $21,499 | $32,282 |
| Standard Deviation (Population) | $21,310 | $31,701 |
Similar Demographics by Median Household Income
Demographics Similar to Tongans by Median Household Income
In terms of median household income, the demographic groups most similar to Tongans are Sri Lankan ($93,093, a difference of 0.020%), Immigrants from Eastern Europe ($93,051, a difference of 0.030%), Immigrants from Bulgaria ($93,148, a difference of 0.080%), Immigrants from Afghanistan ($93,375, a difference of 0.32%), and South African ($93,379, a difference of 0.33%).
| Demographics | Rating | Rank | Median Household Income |
| Immigrants | Egypt | 99.6 /100 | #73 | Exceptional $93,700 |
| Immigrants | Latvia | 99.6 /100 | #74 | Exceptional $93,602 |
| Immigrants | Italy | 99.5 /100 | #75 | Exceptional $93,465 |
| South Africans | 99.5 /100 | #76 | Exceptional $93,379 |
| Immigrants | Afghanistan | 99.5 /100 | #77 | Exceptional $93,375 |
| Immigrants | Bulgaria | 99.4 /100 | #78 | Exceptional $93,148 |
| Sri Lankans | 99.4 /100 | #79 | Exceptional $93,093 |
| Tongans | 99.4 /100 | #80 | Exceptional $93,076 |
| Immigrants | Eastern Europe | 99.4 /100 | #81 | Exceptional $93,051 |
| Immigrants | Spain | 99.3 /100 | #82 | Exceptional $92,732 |
| Italians | 99.1 /100 | #83 | Exceptional $92,475 |
| Immigrants | Argentina | 99.1 /100 | #84 | Exceptional $92,417 |
| Immigrants | Croatia | 99.0 /100 | #85 | Exceptional $92,225 |
| Immigrants | England | 98.9 /100 | #86 | Exceptional $92,098 |
| Immigrants | Hungary | 98.9 /100 | #87 | Exceptional $92,094 |
Demographics Similar to Immigrants from France by Median Household Income
In terms of median household income, the demographic groups most similar to Immigrants from France are Immigrants from Greece ($96,675, a difference of 0.070%), Immigrants from Lithuania ($96,836, a difference of 0.10%), Israeli ($96,552, a difference of 0.20%), Immigrants from Turkey ($96,964, a difference of 0.23%), and Australian ($96,490, a difference of 0.26%).
| Demographics | Rating | Rank | Median Household Income |
| Immigrants | Pakistan | 100.0 /100 | #36 | Exceptional $97,528 |
| Latvians | 100.0 /100 | #37 | Exceptional $97,311 |
| Immigrants | Indonesia | 100.0 /100 | #38 | Exceptional $97,297 |
| Afghans | 100.0 /100 | #39 | Exceptional $97,026 |
| Maltese | 100.0 /100 | #40 | Exceptional $97,015 |
| Immigrants | Turkey | 100.0 /100 | #41 | Exceptional $96,964 |
| Immigrants | Lithuania | 99.9 /100 | #42 | Exceptional $96,836 |
| Immigrants | France | 99.9 /100 | #43 | Exceptional $96,743 |
| Immigrants | Greece | 99.9 /100 | #44 | Exceptional $96,675 |
| Israelis | 99.9 /100 | #45 | Exceptional $96,552 |
| Australians | 99.9 /100 | #46 | Exceptional $96,490 |
| Immigrants | Russia | 99.9 /100 | #47 | Exceptional $96,378 |
| Cambodians | 99.9 /100 | #48 | Exceptional $96,324 |
| Immigrants | Malaysia | 99.9 /100 | #49 | Exceptional $96,292 |
| Bulgarians | 99.9 /100 | #50 | Exceptional $96,290 |