Tongan vs Immigrants from Somalia Median Household Income
COMPARE
Tongan
Immigrants from Somalia
Median Household Income
Median Household Income Comparison
Tongans
Immigrants from Somalia
$93,076
MEDIAN HOUSEHOLD INCOME
99.4/ 100
METRIC RATING
80th/ 347
METRIC RANK
$74,300
MEDIAN HOUSEHOLD INCOME
0.1/ 100
METRIC RATING
286th/ 347
METRIC RANK
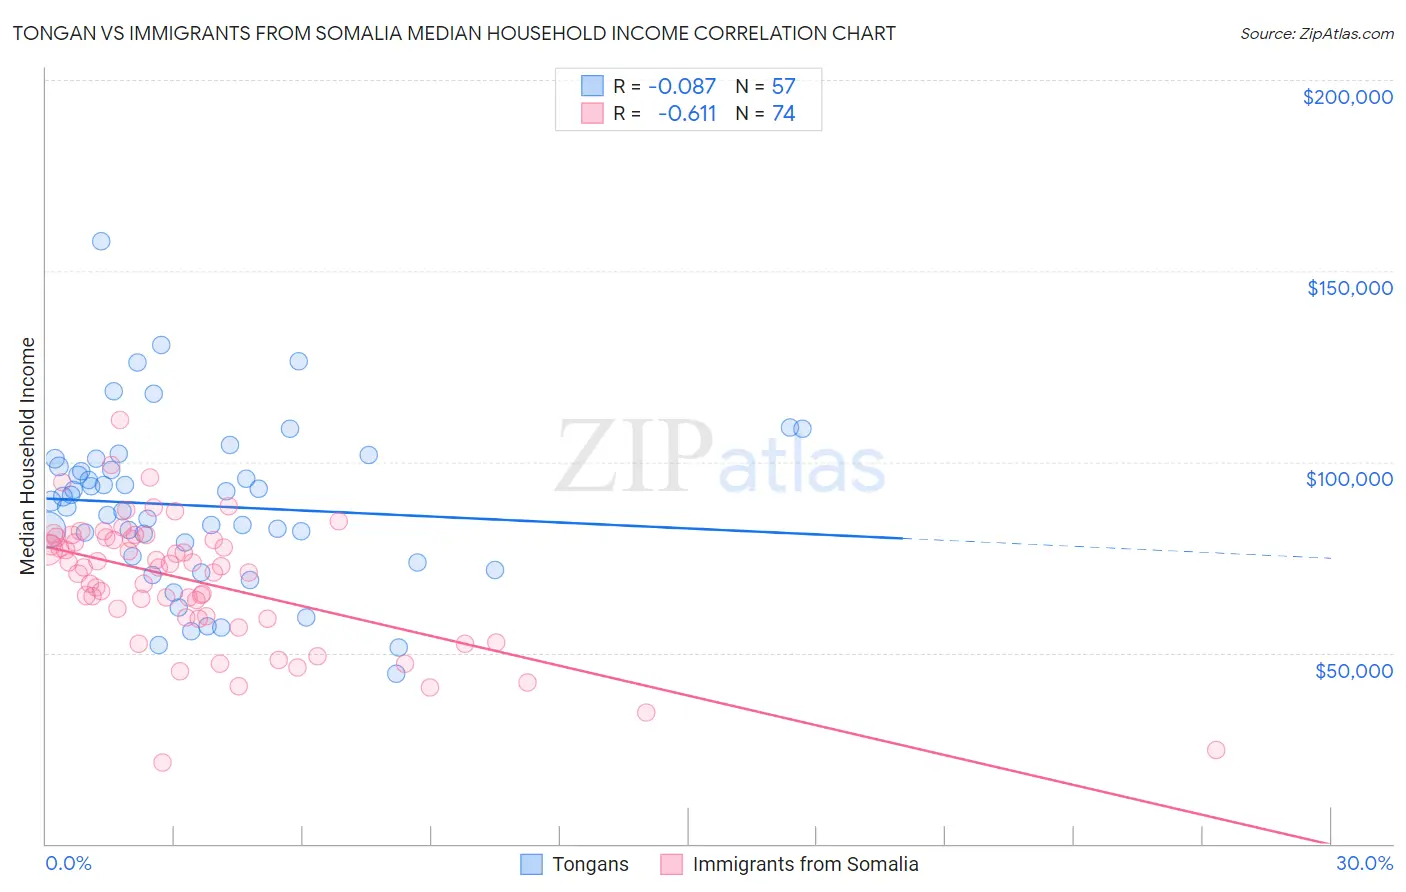
Tongan vs Immigrants from Somalia Median Household Income Correlation Chart
The statistical analysis conducted on geographies consisting of 102,857,692 people shows a slight negative correlation between the proportion of Tongans and median household income in the United States with a correlation coefficient (R) of -0.087 and weighted average of $93,076. Similarly, the statistical analysis conducted on geographies consisting of 92,093,487 people shows a significant negative correlation between the proportion of Immigrants from Somalia and median household income in the United States with a correlation coefficient (R) of -0.611 and weighted average of $74,300, a difference of 25.3%.
Median Household Income Correlation Summary
| Measurement | Tongan | Immigrants from Somalia |
| Minimum | $44,375 | $21,288 |
| Maximum | $157,875 | $111,048 |
| Range | $113,500 | $89,760 |
| Mean | $88,526 | $68,739 |
| Median | $89,840 | $72,392 |
| Interquartile 25% (IQ1) | $74,550 | $59,132 |
| Interquartile 75% (IQ3) | $99,865 | $79,747 |
| Interquartile Range (IQR) | $25,315 | $20,615 |
| Standard Deviation (Sample) | $21,499 | $16,683 |
| Standard Deviation (Population) | $21,310 | $16,570 |
Similar Demographics by Median Household Income
Demographics Similar to Tongans by Median Household Income
In terms of median household income, the demographic groups most similar to Tongans are Sri Lankan ($93,093, a difference of 0.020%), Immigrants from Eastern Europe ($93,051, a difference of 0.030%), Immigrants from Bulgaria ($93,148, a difference of 0.080%), Immigrants from Afghanistan ($93,375, a difference of 0.32%), and South African ($93,379, a difference of 0.33%).
| Demographics | Rating | Rank | Median Household Income |
| Immigrants | Egypt | 99.6 /100 | #73 | Exceptional $93,700 |
| Immigrants | Latvia | 99.6 /100 | #74 | Exceptional $93,602 |
| Immigrants | Italy | 99.5 /100 | #75 | Exceptional $93,465 |
| South Africans | 99.5 /100 | #76 | Exceptional $93,379 |
| Immigrants | Afghanistan | 99.5 /100 | #77 | Exceptional $93,375 |
| Immigrants | Bulgaria | 99.4 /100 | #78 | Exceptional $93,148 |
| Sri Lankans | 99.4 /100 | #79 | Exceptional $93,093 |
| Tongans | 99.4 /100 | #80 | Exceptional $93,076 |
| Immigrants | Eastern Europe | 99.4 /100 | #81 | Exceptional $93,051 |
| Immigrants | Spain | 99.3 /100 | #82 | Exceptional $92,732 |
| Italians | 99.1 /100 | #83 | Exceptional $92,475 |
| Immigrants | Argentina | 99.1 /100 | #84 | Exceptional $92,417 |
| Immigrants | Croatia | 99.0 /100 | #85 | Exceptional $92,225 |
| Immigrants | England | 98.9 /100 | #86 | Exceptional $92,098 |
| Immigrants | Hungary | 98.9 /100 | #87 | Exceptional $92,094 |
Demographics Similar to Immigrants from Somalia by Median Household Income
In terms of median household income, the demographic groups most similar to Immigrants from Somalia are Iroquois ($74,279, a difference of 0.030%), Immigrants from Central America ($74,217, a difference of 0.11%), Mexican ($74,399, a difference of 0.13%), Fijian ($74,205, a difference of 0.13%), and Bangladeshi ($74,112, a difference of 0.25%).
| Demographics | Rating | Rank | Median Household Income |
| Immigrants | Guatemala | 0.2 /100 | #279 | Tragic $75,123 |
| Senegalese | 0.2 /100 | #280 | Tragic $74,999 |
| Immigrants | Liberia | 0.1 /100 | #281 | Tragic $74,896 |
| Central American Indians | 0.1 /100 | #282 | Tragic $74,847 |
| Cree | 0.1 /100 | #283 | Tragic $74,685 |
| Yaqui | 0.1 /100 | #284 | Tragic $74,596 |
| Mexicans | 0.1 /100 | #285 | Tragic $74,399 |
| Immigrants | Somalia | 0.1 /100 | #286 | Tragic $74,300 |
| Iroquois | 0.1 /100 | #287 | Tragic $74,279 |
| Immigrants | Central America | 0.1 /100 | #288 | Tragic $74,217 |
| Fijians | 0.1 /100 | #289 | Tragic $74,205 |
| Bangladeshis | 0.1 /100 | #290 | Tragic $74,112 |
| Hispanics or Latinos | 0.1 /100 | #291 | Tragic $73,823 |
| Comanche | 0.1 /100 | #292 | Tragic $73,747 |
| Immigrants | Cabo Verde | 0.1 /100 | #293 | Tragic $73,515 |