Tongan vs Liberian Median Household Income
COMPARE
Tongan
Liberian
Median Household Income
Median Household Income Comparison
Tongans
Liberians
$93,076
MEDIAN HOUSEHOLD INCOME
99.4/ 100
METRIC RATING
80th/ 347
METRIC RANK
$75,667
MEDIAN HOUSEHOLD INCOME
0.2/ 100
METRIC RATING
273rd/ 347
METRIC RANK
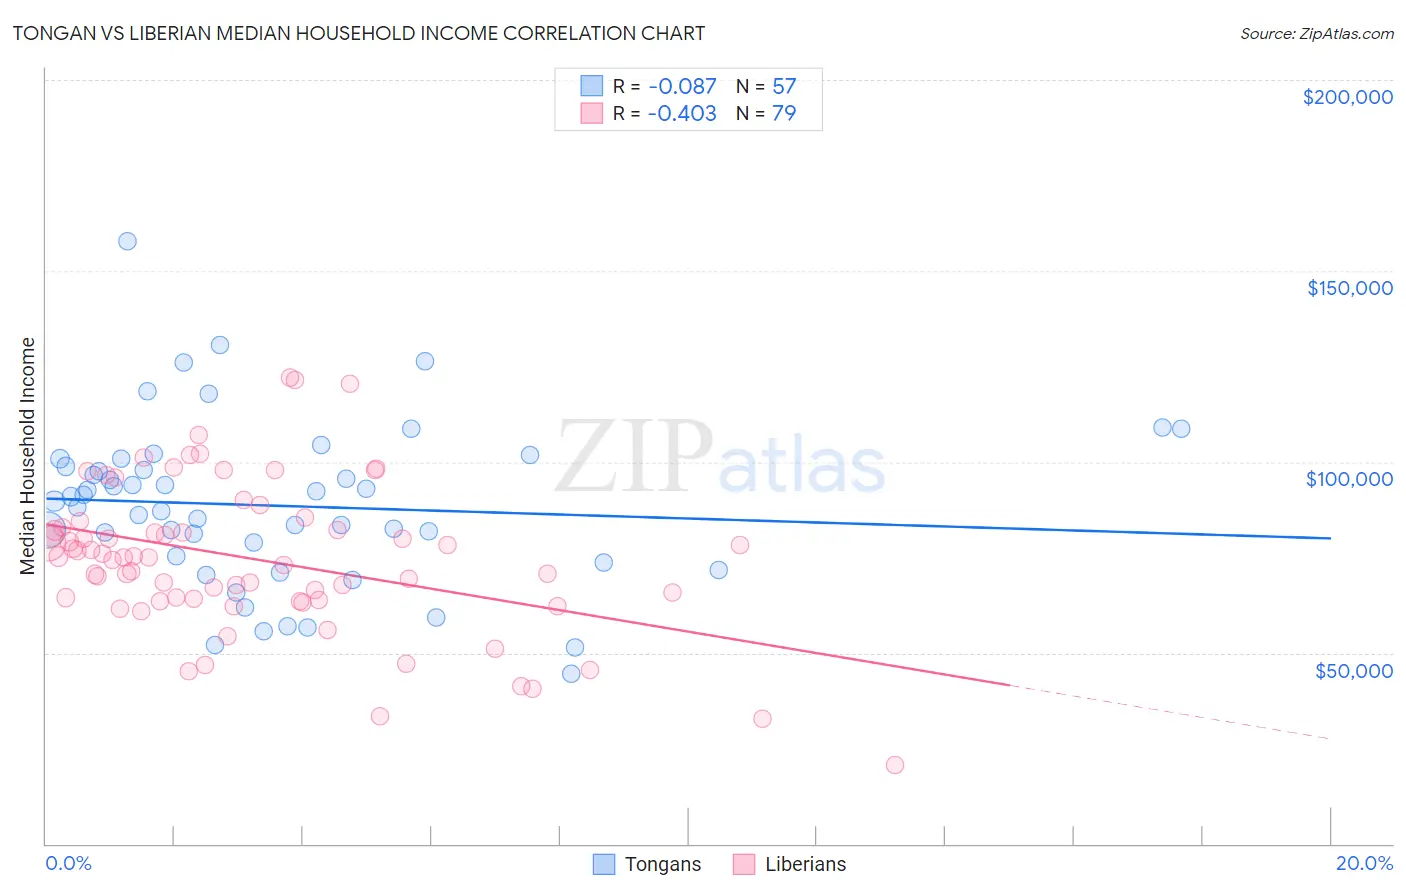
Tongan vs Liberian Median Household Income Correlation Chart
The statistical analysis conducted on geographies consisting of 102,857,692 people shows a slight negative correlation between the proportion of Tongans and median household income in the United States with a correlation coefficient (R) of -0.087 and weighted average of $93,076. Similarly, the statistical analysis conducted on geographies consisting of 118,026,657 people shows a moderate negative correlation between the proportion of Liberians and median household income in the United States with a correlation coefficient (R) of -0.403 and weighted average of $75,667, a difference of 23.0%.
Median Household Income Correlation Summary
| Measurement | Tongan | Liberian |
| Minimum | $44,375 | $20,699 |
| Maximum | $157,875 | $122,146 |
| Range | $113,500 | $101,447 |
| Mean | $88,526 | $74,517 |
| Median | $89,840 | $74,984 |
| Interquartile 25% (IQ1) | $74,550 | $63,718 |
| Interquartile 75% (IQ3) | $99,865 | $82,932 |
| Interquartile Range (IQR) | $25,315 | $19,214 |
| Standard Deviation (Sample) | $21,499 | $19,716 |
| Standard Deviation (Population) | $21,310 | $19,591 |
Similar Demographics by Median Household Income
Demographics Similar to Tongans by Median Household Income
In terms of median household income, the demographic groups most similar to Tongans are Sri Lankan ($93,093, a difference of 0.020%), Immigrants from Eastern Europe ($93,051, a difference of 0.030%), Immigrants from Bulgaria ($93,148, a difference of 0.080%), Immigrants from Afghanistan ($93,375, a difference of 0.32%), and South African ($93,379, a difference of 0.33%).
| Demographics | Rating | Rank | Median Household Income |
| Immigrants | Egypt | 99.6 /100 | #73 | Exceptional $93,700 |
| Immigrants | Latvia | 99.6 /100 | #74 | Exceptional $93,602 |
| Immigrants | Italy | 99.5 /100 | #75 | Exceptional $93,465 |
| South Africans | 99.5 /100 | #76 | Exceptional $93,379 |
| Immigrants | Afghanistan | 99.5 /100 | #77 | Exceptional $93,375 |
| Immigrants | Bulgaria | 99.4 /100 | #78 | Exceptional $93,148 |
| Sri Lankans | 99.4 /100 | #79 | Exceptional $93,093 |
| Tongans | 99.4 /100 | #80 | Exceptional $93,076 |
| Immigrants | Eastern Europe | 99.4 /100 | #81 | Exceptional $93,051 |
| Immigrants | Spain | 99.3 /100 | #82 | Exceptional $92,732 |
| Italians | 99.1 /100 | #83 | Exceptional $92,475 |
| Immigrants | Argentina | 99.1 /100 | #84 | Exceptional $92,417 |
| Immigrants | Croatia | 99.0 /100 | #85 | Exceptional $92,225 |
| Immigrants | England | 98.9 /100 | #86 | Exceptional $92,098 |
| Immigrants | Hungary | 98.9 /100 | #87 | Exceptional $92,094 |
Demographics Similar to Liberians by Median Household Income
In terms of median household income, the demographic groups most similar to Liberians are British West Indian ($75,647, a difference of 0.030%), Immigrants from Micronesia ($75,574, a difference of 0.12%), Somali ($75,782, a difference of 0.15%), Pennsylvania German ($75,814, a difference of 0.19%), and Hmong ($75,839, a difference of 0.23%).
| Demographics | Rating | Rank | Median Household Income |
| Americans | 0.3 /100 | #266 | Tragic $75,932 |
| German Russians | 0.3 /100 | #267 | Tragic $75,856 |
| Immigrants | Jamaica | 0.3 /100 | #268 | Tragic $75,851 |
| Cape Verdeans | 0.3 /100 | #269 | Tragic $75,848 |
| Hmong | 0.3 /100 | #270 | Tragic $75,839 |
| Pennsylvania Germans | 0.3 /100 | #271 | Tragic $75,814 |
| Somalis | 0.3 /100 | #272 | Tragic $75,782 |
| Liberians | 0.2 /100 | #273 | Tragic $75,667 |
| British West Indians | 0.2 /100 | #274 | Tragic $75,647 |
| Immigrants | Micronesia | 0.2 /100 | #275 | Tragic $75,574 |
| Immigrants | Latin America | 0.2 /100 | #276 | Tragic $75,420 |
| Spanish Americans | 0.2 /100 | #277 | Tragic $75,386 |
| Osage | 0.2 /100 | #278 | Tragic $75,240 |
| Immigrants | Guatemala | 0.2 /100 | #279 | Tragic $75,123 |
| Senegalese | 0.2 /100 | #280 | Tragic $74,999 |