Tongan vs Immigrants from Liberia 6th Grade
COMPARE
Tongan
Immigrants from Liberia
6th Grade
6th Grade Comparison
Tongans
Immigrants from Liberia
96.7%
6TH GRADE
6.1/ 100
METRIC RATING
221st/ 347
METRIC RANK
96.6%
6TH GRADE
1.6/ 100
METRIC RATING
243rd/ 347
METRIC RANK
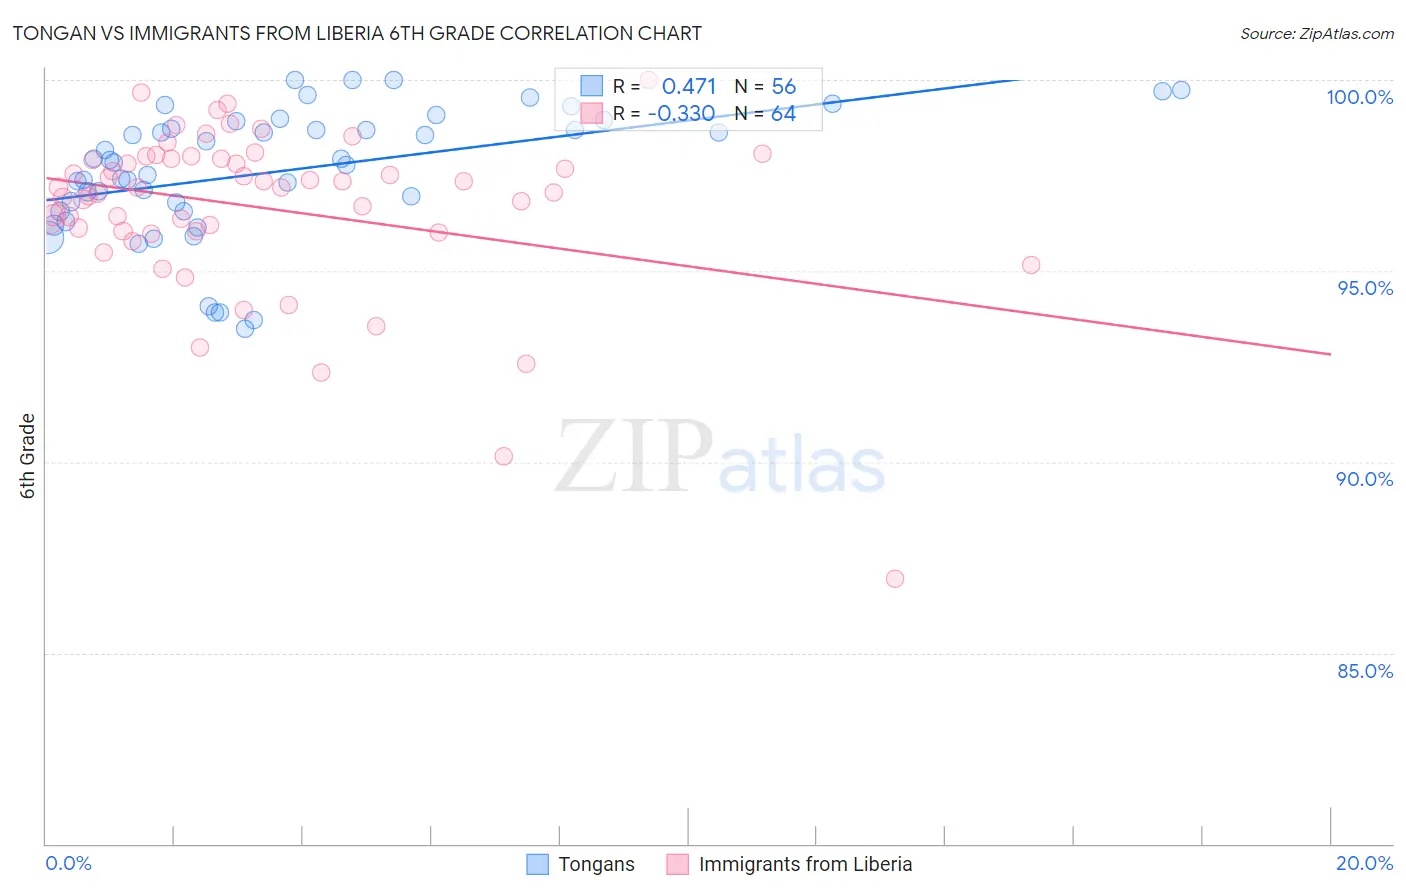
Tongan vs Immigrants from Liberia 6th Grade Correlation Chart
The statistical analysis conducted on geographies consisting of 102,873,790 people shows a moderate positive correlation between the proportion of Tongans and percentage of population with at least 6th grade education in the United States with a correlation coefficient (R) of 0.471 and weighted average of 96.7%. Similarly, the statistical analysis conducted on geographies consisting of 135,294,272 people shows a mild negative correlation between the proportion of Immigrants from Liberia and percentage of population with at least 6th grade education in the United States with a correlation coefficient (R) of -0.330 and weighted average of 96.6%, a difference of 0.16%.
6th Grade Correlation Summary
| Measurement | Tongan | Immigrants from Liberia |
| Minimum | 93.5% | 86.9% |
| Maximum | 100.0% | 100.0% |
| Range | 6.5% | 13.1% |
| Mean | 97.6% | 96.7% |
| Median | 97.9% | 97.2% |
| Interquartile 25% (IQ1) | 96.7% | 96.0% |
| Interquartile 75% (IQ3) | 98.8% | 97.9% |
| Interquartile Range (IQR) | 2.1% | 1.9% |
| Standard Deviation (Sample) | 1.7% | 2.2% |
| Standard Deviation (Population) | 1.7% | 2.2% |
Similar Demographics by 6th Grade
Demographics Similar to Tongans by 6th Grade
In terms of 6th grade, the demographic groups most similar to Tongans are Immigrants from Morocco (96.7%, a difference of 0.0%), Immigrants from Syria (96.7%, a difference of 0.0%), Costa Rican (96.8%, a difference of 0.010%), Liberian (96.8%, a difference of 0.020%), and Navajo (96.8%, a difference of 0.020%).
| Demographics | Rating | Rank | 6th Grade |
| Portuguese | 8.2 /100 | #214 | Tragic 96.8% |
| Sierra Leoneans | 8.0 /100 | #215 | Tragic 96.8% |
| Paiute | 7.8 /100 | #216 | Tragic 96.8% |
| Liberians | 7.5 /100 | #217 | Tragic 96.8% |
| Navajo | 7.3 /100 | #218 | Tragic 96.8% |
| Costa Ricans | 6.8 /100 | #219 | Tragic 96.8% |
| Immigrants | Morocco | 6.2 /100 | #220 | Tragic 96.7% |
| Tongans | 6.1 /100 | #221 | Tragic 96.7% |
| Immigrants | Syria | 5.9 /100 | #222 | Tragic 96.7% |
| Bahamians | 4.8 /100 | #223 | Tragic 96.7% |
| Immigrants | Southern Europe | 4.4 /100 | #224 | Tragic 96.7% |
| Immigrants | Pakistan | 4.4 /100 | #225 | Tragic 96.7% |
| Immigrants | Panama | 4.2 /100 | #226 | Tragic 96.7% |
| Immigrants | Western Asia | 4.1 /100 | #227 | Tragic 96.7% |
| Immigrants | Malaysia | 4.0 /100 | #228 | Tragic 96.7% |
Demographics Similar to Immigrants from Liberia by 6th Grade
In terms of 6th grade, the demographic groups most similar to Immigrants from Liberia are Senegalese (96.6%, a difference of 0.010%), Immigrants from Asia (96.6%, a difference of 0.010%), Ethiopian (96.6%, a difference of 0.010%), Nigerian (96.6%, a difference of 0.020%), and Indian (Asian) (96.6%, a difference of 0.020%).
| Demographics | Rating | Rank | 6th Grade |
| Immigrants | Indonesia | 2.3 /100 | #236 | Tragic 96.6% |
| Immigrants | Eastern Africa | 2.0 /100 | #237 | Tragic 96.6% |
| Nigerians | 1.9 /100 | #238 | Tragic 96.6% |
| Indians (Asian) | 1.9 /100 | #239 | Tragic 96.6% |
| Koreans | 1.9 /100 | #240 | Tragic 96.6% |
| Senegalese | 1.8 /100 | #241 | Tragic 96.6% |
| Immigrants | Asia | 1.8 /100 | #242 | Tragic 96.6% |
| Immigrants | Liberia | 1.6 /100 | #243 | Tragic 96.6% |
| Ethiopians | 1.5 /100 | #244 | Tragic 96.6% |
| Immigrants | Costa Rica | 1.3 /100 | #245 | Tragic 96.6% |
| Immigrants | Africa | 1.3 /100 | #246 | Tragic 96.6% |
| Bolivians | 1.0 /100 | #247 | Tragic 96.5% |
| Tohono O'odham | 1.0 /100 | #248 | Tragic 96.5% |
| Colombians | 0.9 /100 | #249 | Tragic 96.5% |
| Immigrants | Middle Africa | 0.8 /100 | #250 | Tragic 96.5% |