Puget Sound Salish vs Immigrants from Liberia Per Capita Income
COMPARE
Puget Sound Salish
Immigrants from Liberia
Per Capita Income
Per Capita Income Comparison
Puget Sound Salish
Immigrants from Liberia
$41,495
PER CAPITA INCOME
8.1/ 100
METRIC RATING
219th/ 347
METRIC RANK
$38,165
PER CAPITA INCOME
0.2/ 100
METRIC RATING
275th/ 347
METRIC RANK
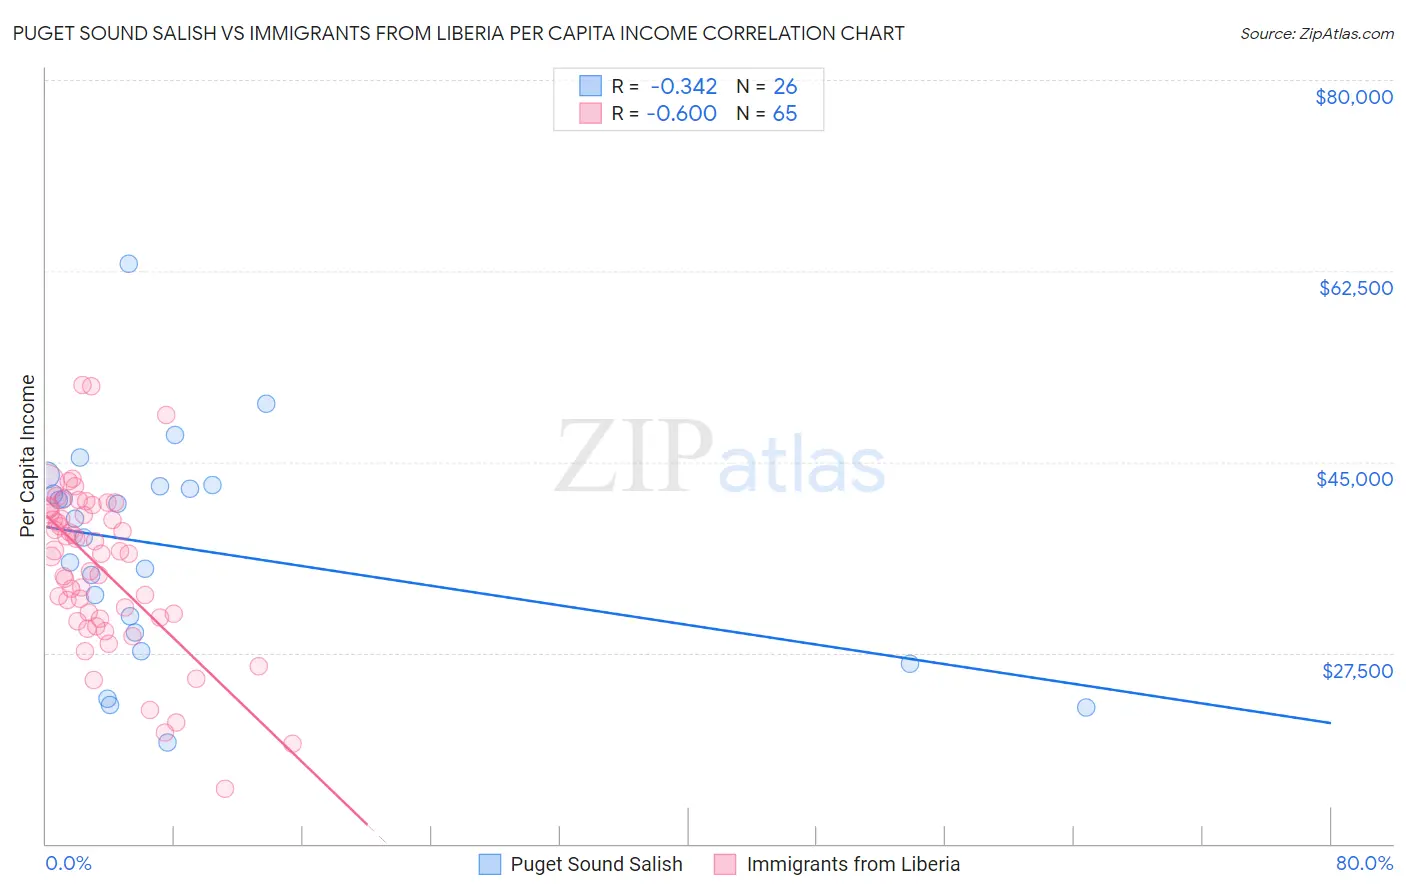
Puget Sound Salish vs Immigrants from Liberia Per Capita Income Correlation Chart
The statistical analysis conducted on geographies consisting of 46,155,865 people shows a mild negative correlation between the proportion of Puget Sound Salish and per capita income in the United States with a correlation coefficient (R) of -0.342 and weighted average of $41,495. Similarly, the statistical analysis conducted on geographies consisting of 135,297,410 people shows a substantial negative correlation between the proportion of Immigrants from Liberia and per capita income in the United States with a correlation coefficient (R) of -0.600 and weighted average of $38,165, a difference of 8.7%.
Per Capita Income Correlation Summary
| Measurement | Puget Sound Salish | Immigrants from Liberia |
| Minimum | $19,247 | $15,041 |
| Maximum | $63,213 | $52,065 |
| Range | $43,966 | $37,024 |
| Mean | $37,040 | $35,319 |
| Median | $38,913 | $36,534 |
| Interquartile 25% (IQ1) | $29,363 | $30,654 |
| Interquartile 75% (IQ3) | $42,776 | $40,514 |
| Interquartile Range (IQR) | $13,413 | $9,860 |
| Standard Deviation (Sample) | $10,042 | $7,386 |
| Standard Deviation (Population) | $9,847 | $7,329 |
Similar Demographics by Per Capita Income
Demographics Similar to Puget Sound Salish by Per Capita Income
In terms of per capita income, the demographic groups most similar to Puget Sound Salish are Immigrants from Barbados ($41,478, a difference of 0.040%), Immigrants from Trinidad and Tobago ($41,476, a difference of 0.040%), Immigrants from Iraq ($41,365, a difference of 0.31%), Trinidadian and Tobagonian ($41,655, a difference of 0.39%), and Immigrants from Cameroon ($41,334, a difference of 0.39%).
| Demographics | Rating | Rank | Per Capita Income |
| Immigrants | Senegal | 11.3 /100 | #212 | Poor $41,830 |
| Immigrants | Venezuela | 10.2 /100 | #213 | Poor $41,727 |
| Immigrants | Bangladesh | 10.1 /100 | #214 | Poor $41,709 |
| Sudanese | 9.9 /100 | #215 | Tragic $41,695 |
| Tongans | 9.9 /100 | #216 | Tragic $41,693 |
| Guamanians/Chamorros | 9.7 /100 | #217 | Tragic $41,678 |
| Trinidadians and Tobagonians | 9.5 /100 | #218 | Tragic $41,655 |
| Puget Sound Salish | 8.1 /100 | #219 | Tragic $41,495 |
| Immigrants | Barbados | 7.9 /100 | #220 | Tragic $41,478 |
| Immigrants | Trinidad and Tobago | 7.9 /100 | #221 | Tragic $41,476 |
| Immigrants | Iraq | 7.1 /100 | #222 | Tragic $41,365 |
| Immigrants | Cameroon | 6.8 /100 | #223 | Tragic $41,334 |
| Immigrants | St. Vincent and the Grenadines | 6.4 /100 | #224 | Tragic $41,270 |
| West Indians | 6.0 /100 | #225 | Tragic $41,217 |
| Immigrants | Ecuador | 5.9 /100 | #226 | Tragic $41,195 |
Demographics Similar to Immigrants from Liberia by Per Capita Income
In terms of per capita income, the demographic groups most similar to Immigrants from Liberia are Hmong ($38,120, a difference of 0.12%), Comanche ($38,088, a difference of 0.20%), Immigrants from Nicaragua ($38,065, a difference of 0.26%), Colville ($38,047, a difference of 0.31%), and Potawatomi ($38,046, a difference of 0.31%).
| Demographics | Rating | Rank | Per Capita Income |
| Liberians | 0.4 /100 | #268 | Tragic $38,780 |
| Immigrants | Jamaica | 0.4 /100 | #269 | Tragic $38,766 |
| Immigrants | Belize | 0.3 /100 | #270 | Tragic $38,614 |
| Central Americans | 0.3 /100 | #271 | Tragic $38,560 |
| Immigrants | Cabo Verde | 0.3 /100 | #272 | Tragic $38,540 |
| Nepalese | 0.3 /100 | #273 | Tragic $38,442 |
| Immigrants | El Salvador | 0.3 /100 | #274 | Tragic $38,394 |
| Immigrants | Liberia | 0.2 /100 | #275 | Tragic $38,165 |
| Hmong | 0.2 /100 | #276 | Tragic $38,120 |
| Comanche | 0.2 /100 | #277 | Tragic $38,088 |
| Immigrants | Nicaragua | 0.2 /100 | #278 | Tragic $38,065 |
| Colville | 0.2 /100 | #279 | Tragic $38,047 |
| Potawatomi | 0.2 /100 | #280 | Tragic $38,046 |
| Immigrants | Dominica | 0.2 /100 | #281 | Tragic $37,952 |
| Immigrants | Laos | 0.1 /100 | #282 | Tragic $37,857 |