Tongan vs Tsimshian Median Female Earnings
COMPARE
Tongan
Tsimshian
Median Female Earnings
Median Female Earnings Comparison
Tongans
Tsimshian
$38,288
MEDIAN FEMALE EARNINGS
5.1/ 100
METRIC RATING
233rd/ 347
METRIC RANK
$39,530
MEDIAN FEMALE EARNINGS
41.4/ 100
METRIC RATING
181st/ 347
METRIC RANK
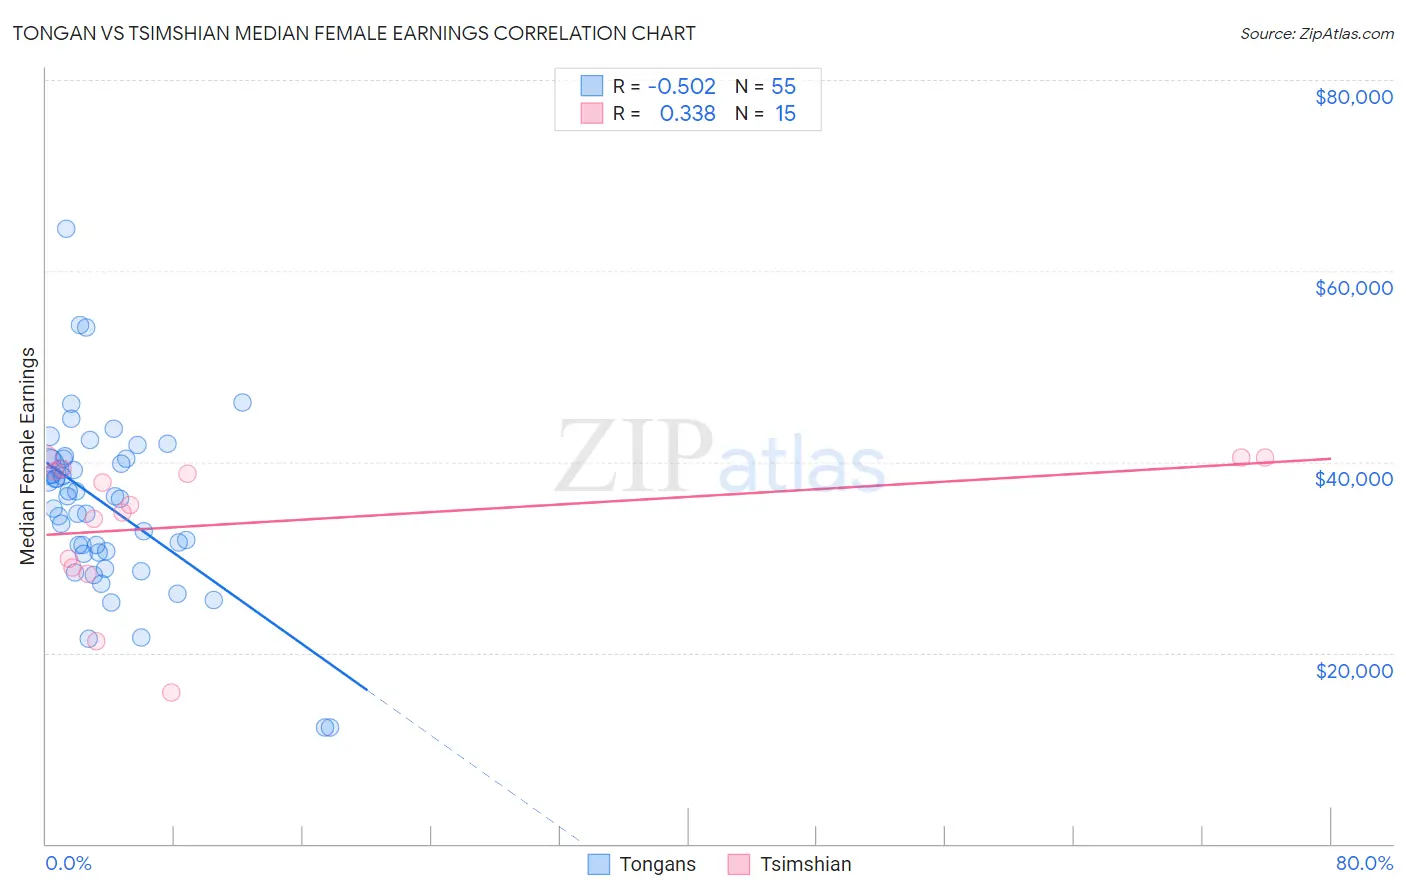
Tongan vs Tsimshian Median Female Earnings Correlation Chart
The statistical analysis conducted on geographies consisting of 102,899,109 people shows a substantial negative correlation between the proportion of Tongans and median female earnings in the United States with a correlation coefficient (R) of -0.502 and weighted average of $38,288. Similarly, the statistical analysis conducted on geographies consisting of 15,624,755 people shows a mild positive correlation between the proportion of Tsimshian and median female earnings in the United States with a correlation coefficient (R) of 0.338 and weighted average of $39,530, a difference of 3.3%.
Median Female Earnings Correlation Summary
| Measurement | Tongan | Tsimshian |
| Minimum | $12,128 | $15,833 |
| Maximum | $64,435 | $40,588 |
| Range | $52,307 | $24,755 |
| Mean | $35,533 | $33,643 |
| Median | $36,346 | $35,500 |
| Interquartile 25% (IQ1) | $30,514 | $28,977 |
| Interquartile 75% (IQ3) | $40,343 | $39,276 |
| Interquartile Range (IQR) | $9,829 | $10,299 |
| Standard Deviation (Sample) | $9,124 | $7,485 |
| Standard Deviation (Population) | $9,040 | $7,232 |
Similar Demographics by Median Female Earnings
Demographics Similar to Tongans by Median Female Earnings
In terms of median female earnings, the demographic groups most similar to Tongans are Celtic ($38,283, a difference of 0.010%), Scandinavian ($38,306, a difference of 0.050%), Somali ($38,333, a difference of 0.12%), Basque ($38,352, a difference of 0.17%), and Sudanese ($38,215, a difference of 0.19%).
| Demographics | Rating | Rank | Median Female Earnings |
| French Canadians | 6.8 /100 | #226 | Tragic $38,436 |
| Scottish | 6.3 /100 | #227 | Tragic $38,397 |
| Sub-Saharan Africans | 6.2 /100 | #228 | Tragic $38,391 |
| Belgians | 6.1 /100 | #229 | Tragic $38,382 |
| Basques | 5.7 /100 | #230 | Tragic $38,352 |
| Somalis | 5.5 /100 | #231 | Tragic $38,333 |
| Scandinavians | 5.2 /100 | #232 | Tragic $38,306 |
| Tongans | 5.1 /100 | #233 | Tragic $38,288 |
| Celtics | 5.0 /100 | #234 | Tragic $38,283 |
| Sudanese | 4.4 /100 | #235 | Tragic $38,215 |
| Liberians | 4.4 /100 | #236 | Tragic $38,215 |
| Immigrants | Cabo Verde | 4.3 /100 | #237 | Tragic $38,208 |
| Alaska Natives | 4.3 /100 | #238 | Tragic $38,202 |
| English | 4.2 /100 | #239 | Tragic $38,196 |
| Finns | 4.0 /100 | #240 | Tragic $38,173 |
Demographics Similar to Tsimshian by Median Female Earnings
In terms of median female earnings, the demographic groups most similar to Tsimshian are Immigrants from Kenya ($39,535, a difference of 0.010%), Tlingit-Haida ($39,513, a difference of 0.050%), Hungarian ($39,510, a difference of 0.050%), Immigrants from Germany ($39,603, a difference of 0.18%), and European ($39,457, a difference of 0.19%).
| Demographics | Rating | Rank | Median Female Earnings |
| South Americans | 50.0 /100 | #174 | Average $39,698 |
| Immigrants | South America | 47.2 /100 | #175 | Average $39,643 |
| Nigerians | 47.0 /100 | #176 | Average $39,641 |
| Costa Ricans | 46.1 /100 | #177 | Average $39,622 |
| Slavs | 45.6 /100 | #178 | Average $39,613 |
| Immigrants | Germany | 45.1 /100 | #179 | Average $39,603 |
| Immigrants | Kenya | 41.6 /100 | #180 | Average $39,535 |
| Tsimshian | 41.4 /100 | #181 | Average $39,530 |
| Tlingit-Haida | 40.5 /100 | #182 | Average $39,513 |
| Hungarians | 40.3 /100 | #183 | Average $39,510 |
| Europeans | 37.7 /100 | #184 | Fair $39,457 |
| Immigrants | West Indies | 36.9 /100 | #185 | Fair $39,441 |
| Colombians | 36.9 /100 | #186 | Fair $39,439 |
| Swedes | 36.0 /100 | #187 | Fair $39,421 |
| Bermudans | 35.9 /100 | #188 | Fair $39,418 |