Comanche vs Immigrants from Bahamas Householder Income Under 25 years
COMPARE
Comanche
Immigrants from Bahamas
Householder Income Under 25 years
Householder Income Under 25 years Comparison
Comanche
Immigrants from Bahamas
$47,518
HOUSEHOLDER INCOME UNDER 25 YEARS
0.0/ 100
METRIC RATING
308th/ 347
METRIC RANK
$45,793
HOUSEHOLDER INCOME UNDER 25 YEARS
0.0/ 100
METRIC RATING
325th/ 347
METRIC RANK
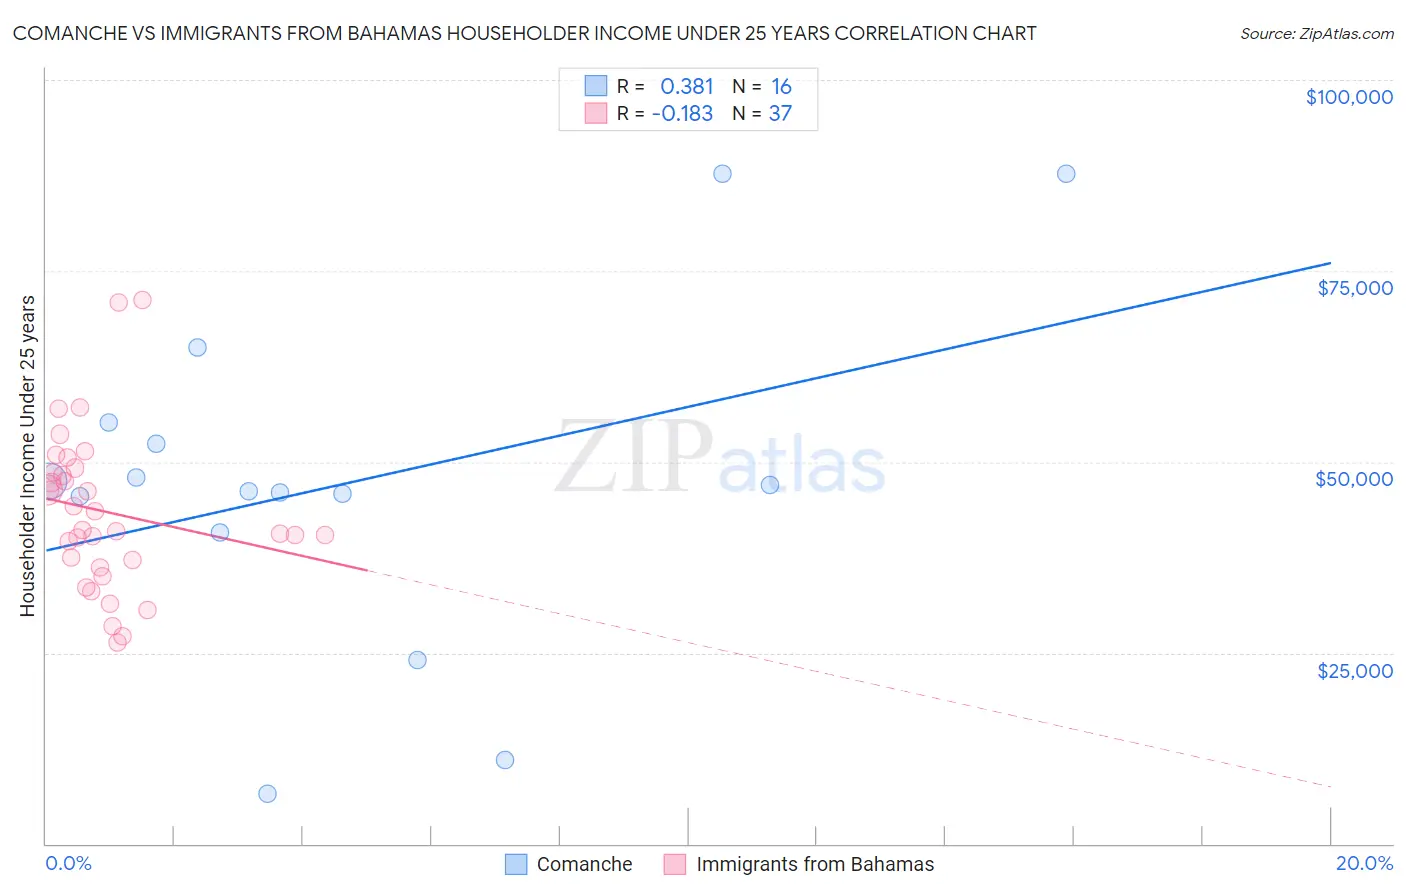
Comanche vs Immigrants from Bahamas Householder Income Under 25 years Correlation Chart
The statistical analysis conducted on geographies consisting of 103,551,593 people shows a mild positive correlation between the proportion of Comanche and household income with householder under the age of 25 in the United States with a correlation coefficient (R) of 0.381 and weighted average of $47,518. Similarly, the statistical analysis conducted on geographies consisting of 97,494,664 people shows a poor negative correlation between the proportion of Immigrants from Bahamas and household income with householder under the age of 25 in the United States with a correlation coefficient (R) of -0.183 and weighted average of $45,793, a difference of 3.8%.
Householder Income Under 25 years Correlation Summary
| Measurement | Comanche | Immigrants from Bahamas |
| Minimum | $6,484 | $26,418 |
| Maximum | $87,727 | $71,250 |
| Range | $81,243 | $44,832 |
| Mean | $47,234 | $43,510 |
| Median | $46,529 | $41,087 |
| Interquartile 25% (IQ1) | $43,131 | $36,692 |
| Interquartile 75% (IQ3) | $53,745 | $48,889 |
| Interquartile Range (IQR) | $10,614 | $12,196 |
| Standard Deviation (Sample) | $21,985 | $10,378 |
| Standard Deviation (Population) | $21,287 | $10,237 |
Demographics Similar to Comanche and Immigrants from Bahamas by Householder Income Under 25 years
In terms of householder income under 25 years, the demographic groups most similar to Comanche are Bangladeshi ($47,589, a difference of 0.15%), U.S. Virgin Islander ($47,448, a difference of 0.15%), Iroquois ($47,380, a difference of 0.29%), Ottawa ($47,366, a difference of 0.32%), and Bermudan ($47,359, a difference of 0.34%). Similarly, the demographic groups most similar to Immigrants from Bahamas are Dutch West Indian ($45,816, a difference of 0.050%), Osage ($45,764, a difference of 0.060%), Immigrants from Saudi Arabia ($46,187, a difference of 0.86%), Sioux ($46,417, a difference of 1.4%), and Potawatomi ($46,462, a difference of 1.5%).
| Demographics | Rating | Rank | Householder Income Under 25 years |
| Natives/Alaskans | 0.0 /100 | #306 | Tragic $47,704 |
| Bangladeshis | 0.0 /100 | #307 | Tragic $47,589 |
| Comanche | 0.0 /100 | #308 | Tragic $47,518 |
| U.S. Virgin Islanders | 0.0 /100 | #309 | Tragic $47,448 |
| Iroquois | 0.0 /100 | #310 | Tragic $47,380 |
| Ottawa | 0.0 /100 | #311 | Tragic $47,366 |
| Bermudans | 0.0 /100 | #312 | Tragic $47,359 |
| Delaware | 0.0 /100 | #313 | Tragic $47,159 |
| Chippewa | 0.0 /100 | #314 | Tragic $47,015 |
| Crow | 0.0 /100 | #315 | Tragic $47,012 |
| Sudanese | 0.0 /100 | #316 | Tragic $46,982 |
| Hopi | 0.0 /100 | #317 | Tragic $46,978 |
| Spanish Americans | 0.0 /100 | #318 | Tragic $46,913 |
| Africans | 0.0 /100 | #319 | Tragic $46,838 |
| Immigrants | Sudan | 0.0 /100 | #320 | Tragic $46,791 |
| Potawatomi | 0.0 /100 | #321 | Tragic $46,462 |
| Sioux | 0.0 /100 | #322 | Tragic $46,417 |
| Immigrants | Saudi Arabia | 0.0 /100 | #323 | Tragic $46,187 |
| Dutch West Indians | 0.0 /100 | #324 | Tragic $45,816 |
| Immigrants | Bahamas | 0.0 /100 | #325 | Tragic $45,793 |
| Osage | 0.0 /100 | #326 | Tragic $45,764 |