Tongan vs Asian Householder Income Under 25 years
COMPARE
Tongan
Asian
Householder Income Under 25 years
Householder Income Under 25 years Comparison
Tongans
Asians
$56,972
HOUSEHOLDER INCOME UNDER 25 YEARS
100.0/ 100
METRIC RATING
23rd/ 347
METRIC RANK
$57,003
HOUSEHOLDER INCOME UNDER 25 YEARS
100.0/ 100
METRIC RATING
22nd/ 347
METRIC RANK
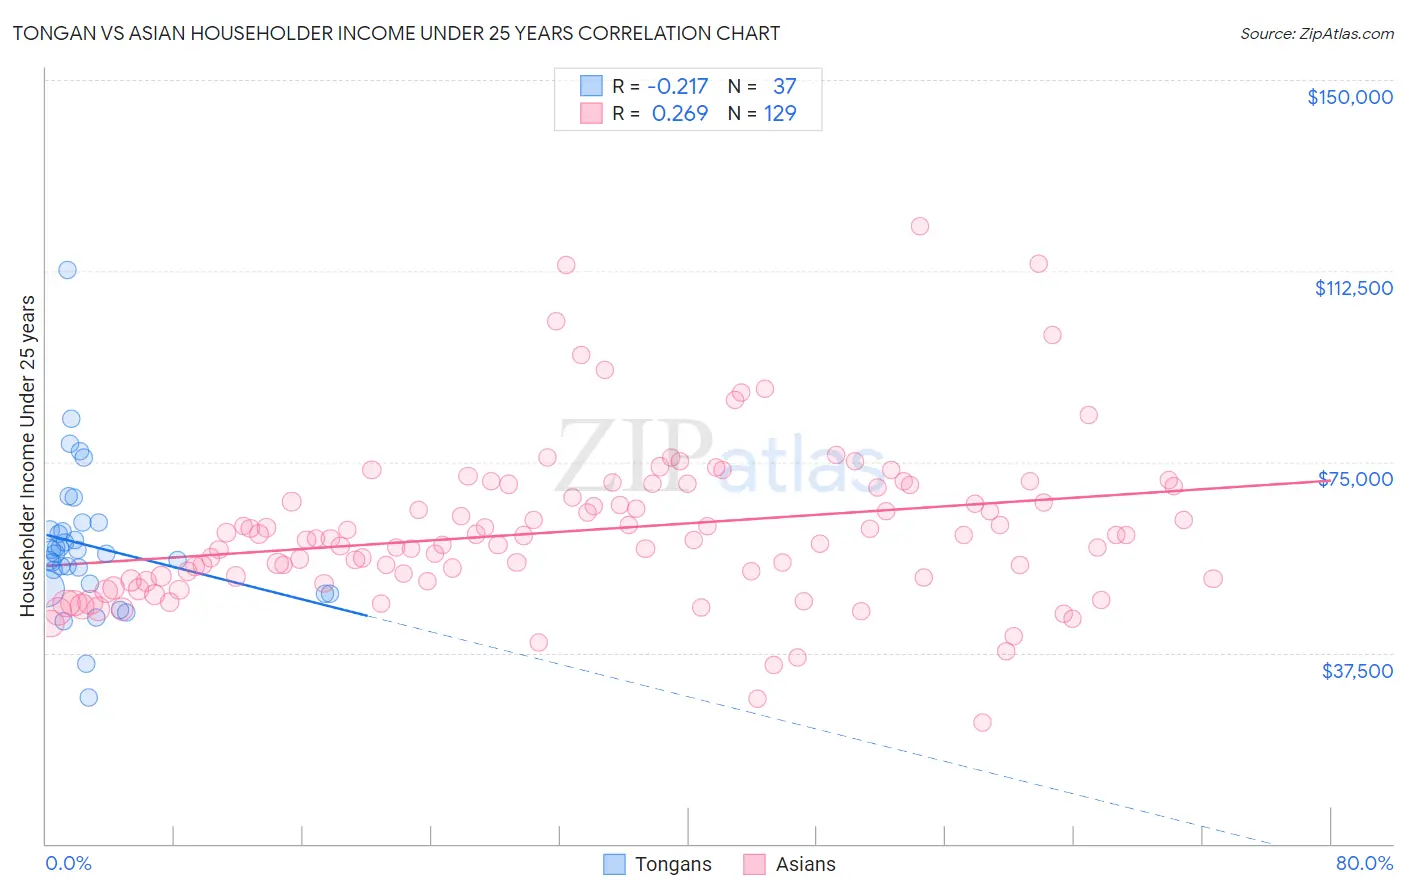
Tongan vs Asian Householder Income Under 25 years Correlation Chart
The statistical analysis conducted on geographies consisting of 96,005,188 people shows a weak negative correlation between the proportion of Tongans and household income with householder under the age of 25 in the United States with a correlation coefficient (R) of -0.217 and weighted average of $56,972. Similarly, the statistical analysis conducted on geographies consisting of 432,159,205 people shows a weak positive correlation between the proportion of Asians and household income with householder under the age of 25 in the United States with a correlation coefficient (R) of 0.269 and weighted average of $57,003, a difference of 0.050%.
Householder Income Under 25 years Correlation Summary
| Measurement | Tongan | Asian |
| Minimum | $28,696 | $23,919 |
| Maximum | $112,736 | $121,254 |
| Range | $84,040 | $97,335 |
| Mean | $58,510 | $61,525 |
| Median | $56,941 | $59,979 |
| Interquartile 25% (IQ1) | $50,618 | $51,878 |
| Interquartile 75% (IQ3) | $62,342 | $70,096 |
| Interquartile Range (IQR) | $11,724 | $18,219 |
| Standard Deviation (Sample) | $14,382 | $15,684 |
| Standard Deviation (Population) | $14,186 | $15,623 |
Demographics Similar to Tongans and Asians by Householder Income Under 25 years
In terms of householder income under 25 years, the demographic groups most similar to Tongans are Bhutanese ($57,078, a difference of 0.18%), Immigrants from Ireland ($57,075, a difference of 0.18%), Immigrants from Fiji ($57,074, a difference of 0.18%), Immigrants from Singapore ($56,835, a difference of 0.24%), and Immigrants from Eastern Asia ($57,123, a difference of 0.26%). Similarly, the demographic groups most similar to Asians are Immigrants from Fiji ($57,074, a difference of 0.12%), Bhutanese ($57,078, a difference of 0.13%), Immigrants from Ireland ($57,075, a difference of 0.13%), Immigrants from Eastern Asia ($57,123, a difference of 0.21%), and Immigrants from Singapore ($56,835, a difference of 0.29%).
| Demographics | Rating | Rank | Householder Income Under 25 years |
| Immigrants | Philippines | 100.0 /100 | #12 | Exceptional $57,930 |
| Immigrants | South Central Asia | 100.0 /100 | #13 | Exceptional $57,818 |
| Filipinos | 100.0 /100 | #14 | Exceptional $57,740 |
| Koreans | 100.0 /100 | #15 | Exceptional $57,730 |
| Immigrants | Afghanistan | 100.0 /100 | #16 | Exceptional $57,478 |
| Sierra Leoneans | 100.0 /100 | #17 | Exceptional $57,272 |
| Immigrants | Eastern Asia | 100.0 /100 | #18 | Exceptional $57,123 |
| Bhutanese | 100.0 /100 | #19 | Exceptional $57,078 |
| Immigrants | Ireland | 100.0 /100 | #20 | Exceptional $57,075 |
| Immigrants | Fiji | 100.0 /100 | #21 | Exceptional $57,074 |
| Asians | 100.0 /100 | #22 | Exceptional $57,003 |
| Tongans | 100.0 /100 | #23 | Exceptional $56,972 |
| Immigrants | Singapore | 100.0 /100 | #24 | Exceptional $56,835 |
| Immigrants | Pakistan | 100.0 /100 | #25 | Exceptional $56,789 |
| Immigrants | Australia | 100.0 /100 | #26 | Exceptional $56,660 |
| Immigrants | North Macedonia | 100.0 /100 | #27 | Exceptional $56,503 |
| Immigrants | Peru | 100.0 /100 | #28 | Exceptional $56,384 |
| Immigrants | Asia | 100.0 /100 | #29 | Exceptional $56,379 |
| Immigrants | Moldova | 100.0 /100 | #30 | Exceptional $56,168 |
| Vietnamese | 100.0 /100 | #31 | Exceptional $56,127 |
| Peruvians | 100.0 /100 | #32 | Exceptional $56,052 |