Mongolian vs Ecuadorian Householder Income Ages 45 - 64 years
COMPARE
Mongolian
Ecuadorian
Householder Income Ages 45 - 64 years
Householder Income Ages 45 - 64 years Comparison
Mongolians
Ecuadorians
$111,602
HOUSEHOLDER INCOME AGES 45 - 64 YEARS
99.6/ 100
METRIC RATING
63rd/ 347
METRIC RANK
$93,739
HOUSEHOLDER INCOME AGES 45 - 64 YEARS
3.6/ 100
METRIC RATING
231st/ 347
METRIC RANK
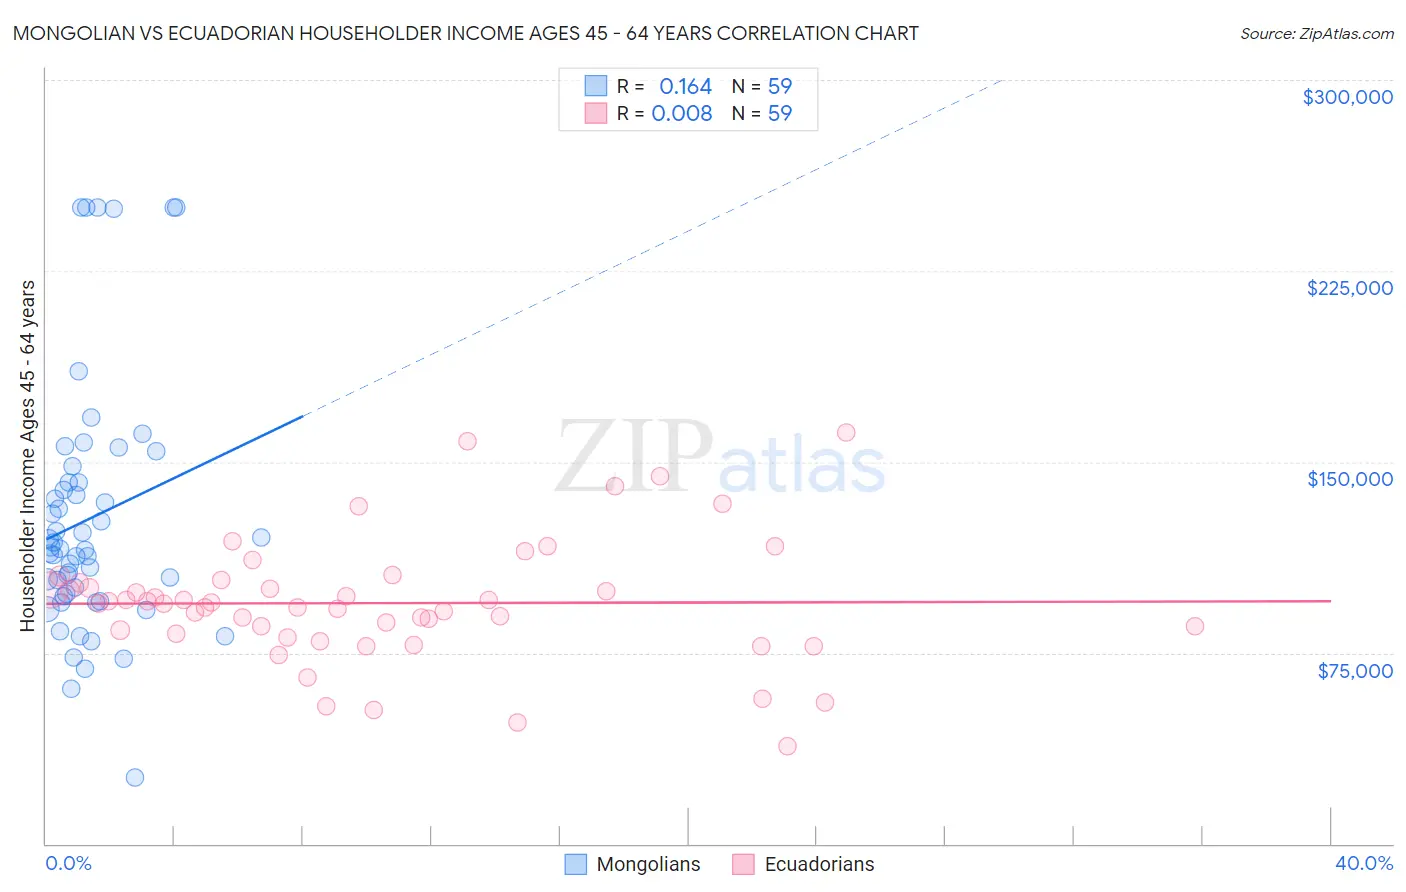
Mongolian vs Ecuadorian Householder Income Ages 45 - 64 years Correlation Chart
The statistical analysis conducted on geographies consisting of 140,216,470 people shows a poor positive correlation between the proportion of Mongolians and household income with householder between the ages 45 and 64 in the United States with a correlation coefficient (R) of 0.164 and weighted average of $111,602. Similarly, the statistical analysis conducted on geographies consisting of 317,361,637 people shows no correlation between the proportion of Ecuadorians and household income with householder between the ages 45 and 64 in the United States with a correlation coefficient (R) of 0.008 and weighted average of $93,739, a difference of 19.1%.
Householder Income Ages 45 - 64 years Correlation Summary
| Measurement | Mongolian | Ecuadorian |
| Minimum | $25,952 | $38,250 |
| Maximum | $250,001 | $161,315 |
| Range | $224,049 | $123,065 |
| Mean | $127,849 | $94,502 |
| Median | $115,953 | $94,317 |
| Interquartile 25% (IQ1) | $97,273 | $82,422 |
| Interquartile 75% (IQ3) | $142,123 | $102,541 |
| Interquartile Range (IQR) | $44,850 | $20,119 |
| Standard Deviation (Sample) | $50,162 | $24,241 |
| Standard Deviation (Population) | $49,735 | $24,034 |
Similar Demographics by Householder Income Ages 45 - 64 years
Demographics Similar to Mongolians by Householder Income Ages 45 - 64 years
In terms of householder income ages 45 - 64 years, the demographic groups most similar to Mongolians are Immigrants from Norway ($111,669, a difference of 0.060%), Immigrants from Latvia ($111,454, a difference of 0.13%), Immigrants from Belarus ($111,430, a difference of 0.15%), Immigrants from Czechoslovakia ($111,914, a difference of 0.28%), and New Zealander ($111,286, a difference of 0.28%).
| Demographics | Rating | Rank | Householder Income Ages 45 - 64 years |
| Egyptians | 99.7 /100 | #56 | Exceptional $112,256 |
| Immigrants | Scotland | 99.7 /100 | #57 | Exceptional $112,175 |
| Soviet Union | 99.7 /100 | #58 | Exceptional $112,008 |
| Immigrants | Europe | 99.7 /100 | #59 | Exceptional $111,984 |
| Immigrants | Netherlands | 99.7 /100 | #60 | Exceptional $111,982 |
| Immigrants | Czechoslovakia | 99.7 /100 | #61 | Exceptional $111,914 |
| Immigrants | Norway | 99.7 /100 | #62 | Exceptional $111,669 |
| Mongolians | 99.6 /100 | #63 | Exceptional $111,602 |
| Immigrants | Latvia | 99.6 /100 | #64 | Exceptional $111,454 |
| Immigrants | Belarus | 99.6 /100 | #65 | Exceptional $111,430 |
| New Zealanders | 99.6 /100 | #66 | Exceptional $111,286 |
| Laotians | 99.5 /100 | #67 | Exceptional $111,051 |
| Immigrants | Romania | 99.4 /100 | #68 | Exceptional $110,633 |
| Immigrants | Italy | 99.4 /100 | #69 | Exceptional $110,434 |
| Koreans | 99.3 /100 | #70 | Exceptional $110,334 |
Demographics Similar to Ecuadorians by Householder Income Ages 45 - 64 years
In terms of householder income ages 45 - 64 years, the demographic groups most similar to Ecuadorians are Sudanese ($93,718, a difference of 0.020%), Immigrants from Sudan ($93,781, a difference of 0.040%), Vietnamese ($93,788, a difference of 0.050%), Immigrants from Panama ($93,815, a difference of 0.080%), and Alaska Native ($93,991, a difference of 0.27%).
| Demographics | Rating | Rank | Householder Income Ages 45 - 64 years |
| Immigrants | Bosnia and Herzegovina | 4.6 /100 | #224 | Tragic $94,288 |
| Bermudans | 4.4 /100 | #225 | Tragic $94,197 |
| Immigrants | Azores | 4.3 /100 | #226 | Tragic $94,138 |
| Alaska Natives | 4.0 /100 | #227 | Tragic $93,991 |
| Immigrants | Panama | 3.7 /100 | #228 | Tragic $93,815 |
| Vietnamese | 3.6 /100 | #229 | Tragic $93,788 |
| Immigrants | Sudan | 3.6 /100 | #230 | Tragic $93,781 |
| Ecuadorians | 3.6 /100 | #231 | Tragic $93,739 |
| Sudanese | 3.5 /100 | #232 | Tragic $93,718 |
| Nepalese | 3.0 /100 | #233 | Tragic $93,355 |
| Immigrants | El Salvador | 2.7 /100 | #234 | Tragic $93,176 |
| Nicaraguans | 2.0 /100 | #235 | Tragic $92,554 |
| Immigrants | Western Africa | 1.8 /100 | #236 | Tragic $92,384 |
| Immigrants | Bangladesh | 1.7 /100 | #237 | Tragic $92,208 |
| Pennsylvania Germans | 1.5 /100 | #238 | Tragic $91,956 |