Spanish American vs Immigrants from Senegal Median Household Income
COMPARE
Spanish American
Immigrants from Senegal
Median Household Income
Median Household Income Comparison
Spanish Americans
Immigrants from Senegal
$75,386
MEDIAN HOUSEHOLD INCOME
0.2/ 100
METRIC RATING
277th/ 347
METRIC RANK
$76,915
MEDIAN HOUSEHOLD INCOME
0.5/ 100
METRIC RATING
257th/ 347
METRIC RANK
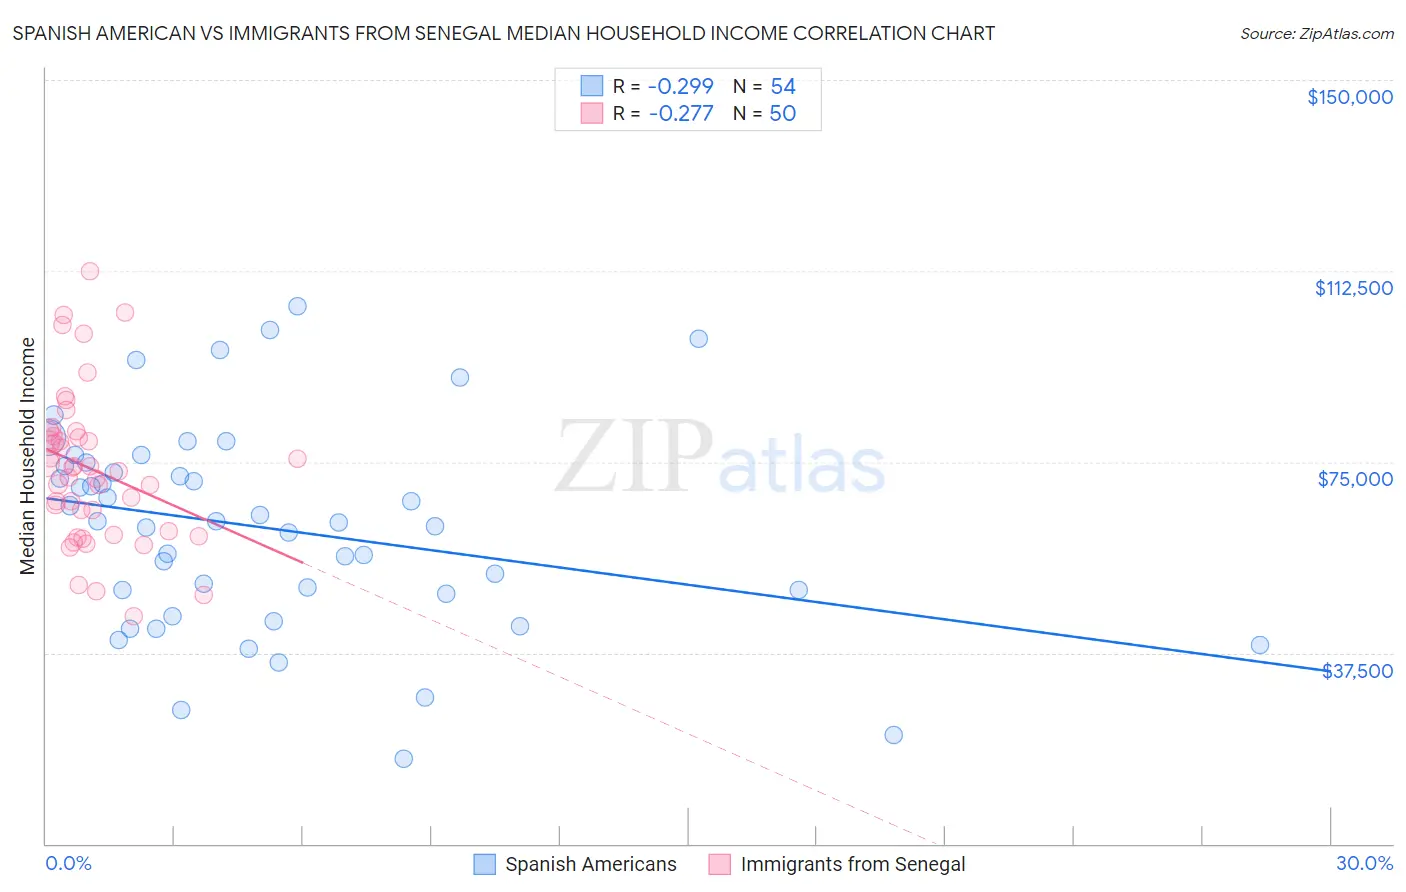
Spanish American vs Immigrants from Senegal Median Household Income Correlation Chart
The statistical analysis conducted on geographies consisting of 103,163,457 people shows a weak negative correlation between the proportion of Spanish Americans and median household income in the United States with a correlation coefficient (R) of -0.299 and weighted average of $75,386. Similarly, the statistical analysis conducted on geographies consisting of 90,107,777 people shows a weak negative correlation between the proportion of Immigrants from Senegal and median household income in the United States with a correlation coefficient (R) of -0.277 and weighted average of $76,915, a difference of 2.0%.
Median Household Income Correlation Summary
| Measurement | Spanish American | Immigrants from Senegal |
| Minimum | $16,806 | $44,770 |
| Maximum | $105,648 | $112,479 |
| Range | $88,842 | $67,709 |
| Mean | $61,918 | $73,616 |
| Median | $63,227 | $73,578 |
| Interquartile 25% (IQ1) | $49,158 | $61,261 |
| Interquartile 75% (IQ3) | $74,166 | $80,057 |
| Interquartile Range (IQR) | $25,008 | $18,796 |
| Standard Deviation (Sample) | $20,311 | $14,821 |
| Standard Deviation (Population) | $20,122 | $14,672 |
Demographics Similar to Spanish Americans and Immigrants from Senegal by Median Household Income
In terms of median household income, the demographic groups most similar to Spanish Americans are Immigrants from Latin America ($75,420, a difference of 0.040%), Immigrants from Micronesia ($75,574, a difference of 0.25%), British West Indian ($75,647, a difference of 0.35%), Liberian ($75,667, a difference of 0.37%), and Somali ($75,782, a difference of 0.52%). Similarly, the demographic groups most similar to Immigrants from Senegal are Immigrants from Nicaragua ($76,784, a difference of 0.17%), Spanish American Indian ($76,670, a difference of 0.32%), Jamaican ($76,583, a difference of 0.43%), Immigrants from Grenada ($76,517, a difference of 0.52%), and French American Indian ($76,387, a difference of 0.69%).
| Demographics | Rating | Rank | Median Household Income |
| Immigrants | Senegal | 0.5 /100 | #257 | Tragic $76,915 |
| Immigrants | Nicaragua | 0.5 /100 | #258 | Tragic $76,784 |
| Spanish American Indians | 0.4 /100 | #259 | Tragic $76,670 |
| Jamaicans | 0.4 /100 | #260 | Tragic $76,583 |
| Immigrants | Grenada | 0.4 /100 | #261 | Tragic $76,517 |
| French American Indians | 0.4 /100 | #262 | Tragic $76,387 |
| Alaskan Athabascans | 0.4 /100 | #263 | Tragic $76,383 |
| Guatemalans | 0.3 /100 | #264 | Tragic $75,961 |
| Immigrants | Belize | 0.3 /100 | #265 | Tragic $75,938 |
| Americans | 0.3 /100 | #266 | Tragic $75,932 |
| German Russians | 0.3 /100 | #267 | Tragic $75,856 |
| Immigrants | Jamaica | 0.3 /100 | #268 | Tragic $75,851 |
| Cape Verdeans | 0.3 /100 | #269 | Tragic $75,848 |
| Hmong | 0.3 /100 | #270 | Tragic $75,839 |
| Pennsylvania Germans | 0.3 /100 | #271 | Tragic $75,814 |
| Somalis | 0.3 /100 | #272 | Tragic $75,782 |
| Liberians | 0.2 /100 | #273 | Tragic $75,667 |
| British West Indians | 0.2 /100 | #274 | Tragic $75,647 |
| Immigrants | Micronesia | 0.2 /100 | #275 | Tragic $75,574 |
| Immigrants | Latin America | 0.2 /100 | #276 | Tragic $75,420 |
| Spanish Americans | 0.2 /100 | #277 | Tragic $75,386 |