Crow vs Immigrants from Senegal Median Household Income
COMPARE
Crow
Immigrants from Senegal
Median Household Income
Median Household Income Comparison
Crow
Immigrants from Senegal
$63,681
MEDIAN HOUSEHOLD INCOME
0.0/ 100
METRIC RATING
341st/ 347
METRIC RANK
$76,915
MEDIAN HOUSEHOLD INCOME
0.5/ 100
METRIC RATING
257th/ 347
METRIC RANK
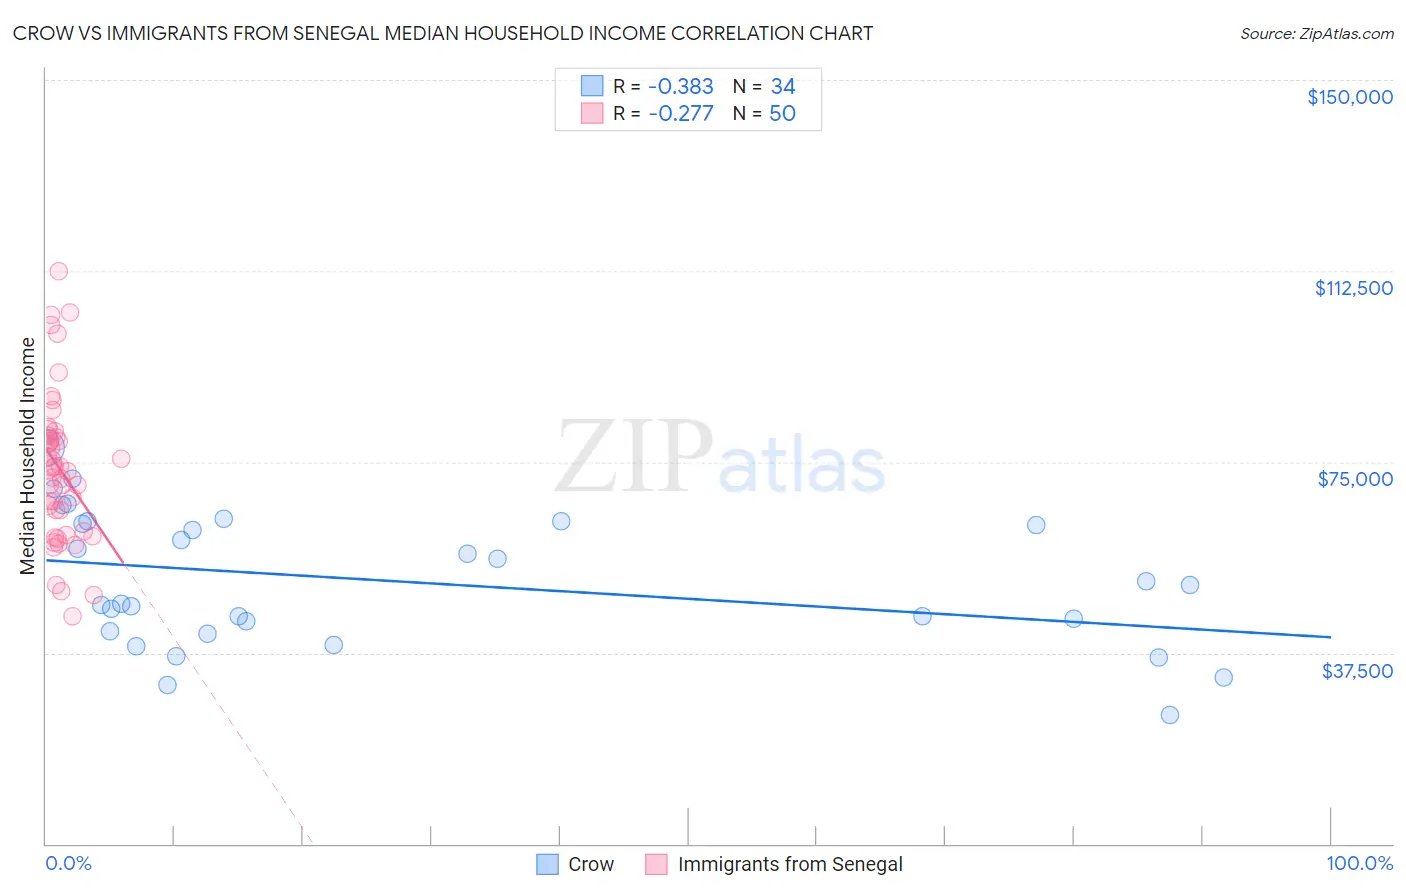
Crow vs Immigrants from Senegal Median Household Income Correlation Chart
The statistical analysis conducted on geographies consisting of 59,197,360 people shows a mild negative correlation between the proportion of Crow and median household income in the United States with a correlation coefficient (R) of -0.383 and weighted average of $63,681. Similarly, the statistical analysis conducted on geographies consisting of 90,107,777 people shows a weak negative correlation between the proportion of Immigrants from Senegal and median household income in the United States with a correlation coefficient (R) of -0.277 and weighted average of $76,915, a difference of 20.8%.
Median Household Income Correlation Summary
| Measurement | Crow | Immigrants from Senegal |
| Minimum | $25,179 | $44,770 |
| Maximum | $77,725 | $112,479 |
| Range | $52,546 | $67,709 |
| Mean | $51,476 | $73,616 |
| Median | $48,948 | $73,578 |
| Interquartile 25% (IQ1) | $41,650 | $61,261 |
| Interquartile 75% (IQ3) | $62,906 | $80,057 |
| Interquartile Range (IQR) | $21,256 | $18,796 |
| Standard Deviation (Sample) | $12,984 | $14,821 |
| Standard Deviation (Population) | $12,792 | $14,672 |
Similar Demographics by Median Household Income
Demographics Similar to Crow by Median Household Income
In terms of median household income, the demographic groups most similar to Crow are Pima ($63,262, a difference of 0.66%), Pueblo ($64,692, a difference of 1.6%), Houma ($62,575, a difference of 1.8%), Hopi ($65,043, a difference of 2.1%), and Immigrants from Yemen ($65,194, a difference of 2.4%).
| Demographics | Rating | Rank | Median Household Income |
| Creek | 0.0 /100 | #333 | Tragic $67,715 |
| Blacks/African Americans | 0.0 /100 | #334 | Tragic $67,573 |
| Cheyenne | 0.0 /100 | #335 | Tragic $66,974 |
| Immigrants | Congo | 0.0 /100 | #336 | Tragic $66,768 |
| Kiowa | 0.0 /100 | #337 | Tragic $65,914 |
| Immigrants | Yemen | 0.0 /100 | #338 | Tragic $65,194 |
| Hopi | 0.0 /100 | #339 | Tragic $65,043 |
| Pueblo | 0.0 /100 | #340 | Tragic $64,692 |
| Crow | 0.0 /100 | #341 | Tragic $63,681 |
| Pima | 0.0 /100 | #342 | Tragic $63,262 |
| Houma | 0.0 /100 | #343 | Tragic $62,575 |
| Tohono O'odham | 0.0 /100 | #344 | Tragic $61,663 |
| Puerto Ricans | 0.0 /100 | #345 | Tragic $59,197 |
| Navajo | 0.0 /100 | #346 | Tragic $59,159 |
| Lumbee | 0.0 /100 | #347 | Tragic $54,644 |
Demographics Similar to Immigrants from Senegal by Median Household Income
In terms of median household income, the demographic groups most similar to Immigrants from Senegal are Belizean ($77,028, a difference of 0.15%), Immigrants from Nicaragua ($76,784, a difference of 0.17%), Spanish American Indian ($76,670, a difference of 0.32%), Jamaican ($76,583, a difference of 0.43%), and Immigrants from Grenada ($76,517, a difference of 0.52%).
| Demographics | Rating | Rank | Median Household Income |
| Immigrants | Laos | 1.3 /100 | #250 | Tragic $78,327 |
| Mexican American Indians | 1.2 /100 | #251 | Tragic $78,166 |
| Immigrants | West Indies | 1.0 /100 | #252 | Tragic $77,956 |
| Immigrants | St. Vincent and the Grenadines | 0.9 /100 | #253 | Tragic $77,690 |
| Sub-Saharan Africans | 0.8 /100 | #254 | Tragic $77,631 |
| Immigrants | Middle Africa | 0.8 /100 | #255 | Tragic $77,559 |
| Belizeans | 0.6 /100 | #256 | Tragic $77,028 |
| Immigrants | Senegal | 0.5 /100 | #257 | Tragic $76,915 |
| Immigrants | Nicaragua | 0.5 /100 | #258 | Tragic $76,784 |
| Spanish American Indians | 0.4 /100 | #259 | Tragic $76,670 |
| Jamaicans | 0.4 /100 | #260 | Tragic $76,583 |
| Immigrants | Grenada | 0.4 /100 | #261 | Tragic $76,517 |
| French American Indians | 0.4 /100 | #262 | Tragic $76,387 |
| Alaskan Athabascans | 0.4 /100 | #263 | Tragic $76,383 |
| Guatemalans | 0.3 /100 | #264 | Tragic $75,961 |