Taiwanese vs Marshallese Median Household Income
COMPARE
Taiwanese
Marshallese
Median Household Income
Median Household Income Comparison
Taiwanese
Marshallese
$89,900
MEDIAN HOUSEHOLD INCOME
95.6/ 100
METRIC RATING
117th/ 347
METRIC RANK
$78,930
MEDIAN HOUSEHOLD INCOME
1.9/ 100
METRIC RATING
244th/ 347
METRIC RANK
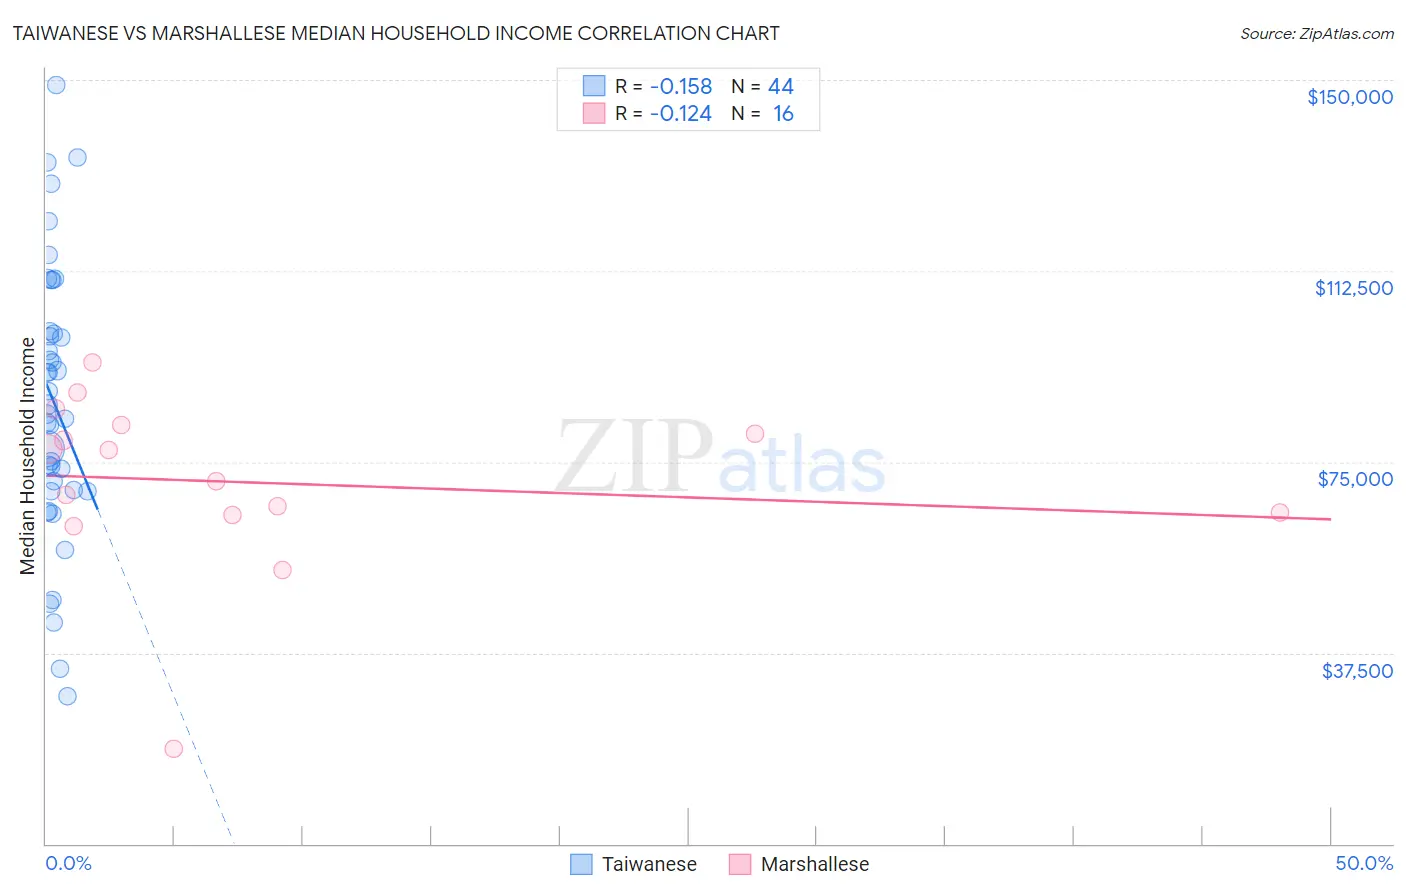
Taiwanese vs Marshallese Median Household Income Correlation Chart
The statistical analysis conducted on geographies consisting of 31,709,765 people shows a poor negative correlation between the proportion of Taiwanese and median household income in the United States with a correlation coefficient (R) of -0.158 and weighted average of $89,900. Similarly, the statistical analysis conducted on geographies consisting of 14,761,315 people shows a poor negative correlation between the proportion of Marshallese and median household income in the United States with a correlation coefficient (R) of -0.124 and weighted average of $78,930, a difference of 13.9%.
Median Household Income Correlation Summary
| Measurement | Taiwanese | Marshallese |
| Minimum | $29,038 | $18,739 |
| Maximum | $149,028 | $94,608 |
| Range | $119,990 | $75,869 |
| Mean | $86,573 | $71,002 |
| Median | $85,327 | $74,280 |
| Interquartile 25% (IQ1) | $69,445 | $64,792 |
| Interquartile 75% (IQ3) | $100,383 | $81,406 |
| Interquartile Range (IQR) | $30,938 | $16,615 |
| Standard Deviation (Sample) | $26,800 | $17,620 |
| Standard Deviation (Population) | $26,494 | $17,060 |
Similar Demographics by Median Household Income
Demographics Similar to Taiwanese by Median Household Income
In terms of median household income, the demographic groups most similar to Taiwanese are Native Hawaiian ($89,919, a difference of 0.020%), Syrian ($89,830, a difference of 0.080%), Immigrants from Western Asia ($90,005, a difference of 0.12%), Immigrants from Northern Africa ($90,026, a difference of 0.14%), and Albanian ($89,744, a difference of 0.17%).
| Demographics | Rating | Rank | Median Household Income |
| Palestinians | 97.1 /100 | #110 | Exceptional $90,574 |
| Immigrants | Poland | 97.1 /100 | #111 | Exceptional $90,549 |
| Northern Europeans | 96.9 /100 | #112 | Exceptional $90,446 |
| Peruvians | 96.5 /100 | #113 | Exceptional $90,261 |
| Immigrants | Northern Africa | 95.9 /100 | #114 | Exceptional $90,026 |
| Immigrants | Western Asia | 95.9 /100 | #115 | Exceptional $90,005 |
| Native Hawaiians | 95.7 /100 | #116 | Exceptional $89,919 |
| Taiwanese | 95.6 /100 | #117 | Exceptional $89,900 |
| Syrians | 95.4 /100 | #118 | Exceptional $89,830 |
| Albanians | 95.2 /100 | #119 | Exceptional $89,744 |
| Immigrants | North Macedonia | 95.2 /100 | #120 | Exceptional $89,741 |
| Ethiopians | 94.9 /100 | #121 | Exceptional $89,640 |
| Pakistanis | 94.8 /100 | #122 | Exceptional $89,638 |
| Immigrants | Zimbabwe | 94.4 /100 | #123 | Exceptional $89,496 |
| Immigrants | Jordan | 94.1 /100 | #124 | Exceptional $89,412 |
Demographics Similar to Marshallese by Median Household Income
In terms of median household income, the demographic groups most similar to Marshallese are Immigrants from Barbados ($78,989, a difference of 0.080%), Inupiat ($78,841, a difference of 0.11%), Central American ($78,803, a difference of 0.16%), Immigrants from Sudan ($79,103, a difference of 0.22%), and Immigrants from Burma/Myanmar ($78,682, a difference of 0.32%).
| Demographics | Rating | Rank | Median Household Income |
| Nicaraguans | 3.1 /100 | #237 | Tragic $79,737 |
| Barbadians | 3.0 /100 | #238 | Tragic $79,664 |
| Alaska Natives | 2.7 /100 | #239 | Tragic $79,509 |
| Immigrants | Western Africa | 2.7 /100 | #240 | Tragic $79,490 |
| Immigrants | Nonimmigrants | 2.6 /100 | #241 | Tragic $79,429 |
| Immigrants | Sudan | 2.1 /100 | #242 | Tragic $79,103 |
| Immigrants | Barbados | 1.9 /100 | #243 | Tragic $78,989 |
| Marshallese | 1.9 /100 | #244 | Tragic $78,930 |
| Inupiat | 1.8 /100 | #245 | Tragic $78,841 |
| Central Americans | 1.7 /100 | #246 | Tragic $78,803 |
| Immigrants | Burma/Myanmar | 1.6 /100 | #247 | Tragic $78,682 |
| Sudanese | 1.5 /100 | #248 | Tragic $78,529 |
| West Indians | 1.4 /100 | #249 | Tragic $78,455 |
| Immigrants | Laos | 1.3 /100 | #250 | Tragic $78,327 |
| Mexican American Indians | 1.2 /100 | #251 | Tragic $78,166 |