Taiwanese vs Immigrants from Norway Child Poverty Under the Age of 16
COMPARE
Taiwanese
Immigrants from Norway
Child Poverty Under the Age of 16
Child Poverty Under the Age of 16 Comparison
Taiwanese
Immigrants from Norway
14.5%
CHILD POVERTY UNDER THE AGE OF 16
97.1/ 100
METRIC RATING
87th/ 347
METRIC RANK
15.0%
CHILD POVERTY UNDER THE AGE OF 16
92.8/ 100
METRIC RATING
117th/ 347
METRIC RANK
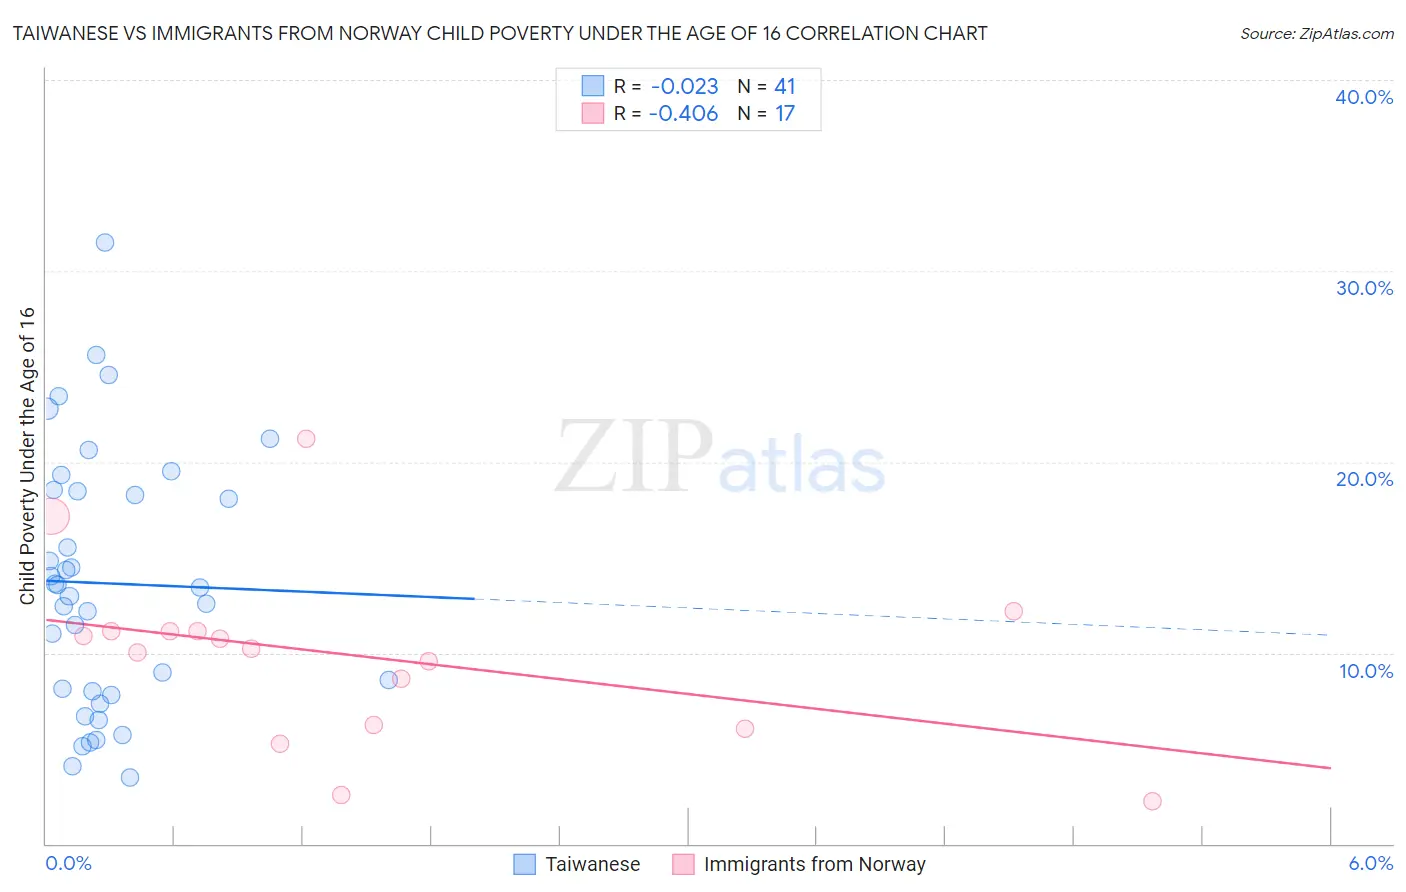
Taiwanese vs Immigrants from Norway Child Poverty Under the Age of 16 Correlation Chart
The statistical analysis conducted on geographies consisting of 31,625,785 people shows no correlation between the proportion of Taiwanese and poverty level among children under the age of 16 in the United States with a correlation coefficient (R) of -0.023 and weighted average of 14.5%. Similarly, the statistical analysis conducted on geographies consisting of 116,192,313 people shows a moderate negative correlation between the proportion of Immigrants from Norway and poverty level among children under the age of 16 in the United States with a correlation coefficient (R) of -0.406 and weighted average of 15.0%, a difference of 3.2%.
Child Poverty Under the Age of 16 Correlation Summary
| Measurement | Taiwanese | Immigrants from Norway |
| Minimum | 3.4% | 2.2% |
| Maximum | 31.5% | 21.2% |
| Range | 28.1% | 19.0% |
| Mean | 13.6% | 9.8% |
| Median | 13.4% | 10.2% |
| Interquartile 25% (IQ1) | 7.9% | 6.1% |
| Interquartile 75% (IQ3) | 18.5% | 11.1% |
| Interquartile Range (IQR) | 10.6% | 5.0% |
| Standard Deviation (Sample) | 6.7% | 4.7% |
| Standard Deviation (Population) | 6.6% | 4.6% |
Similar Demographics by Child Poverty Under the Age of 16
Demographics Similar to Taiwanese by Child Poverty Under the Age of 16
In terms of child poverty under the age of 16, the demographic groups most similar to Taiwanese are Immigrants from Argentina (14.5%, a difference of 0.0%), Soviet Union (14.5%, a difference of 0.080%), Immigrants from Latvia (14.5%, a difference of 0.10%), Northern European (14.5%, a difference of 0.10%), and Egyptian (14.5%, a difference of 0.12%).
| Demographics | Rating | Rank | Child Poverty Under the Age of 16 |
| Immigrants | North Macedonia | 97.2 /100 | #80 | Exceptional 14.5% |
| Finns | 97.2 /100 | #81 | Exceptional 14.5% |
| Immigrants | Canada | 97.2 /100 | #82 | Exceptional 14.5% |
| Egyptians | 97.2 /100 | #83 | Exceptional 14.5% |
| Immigrants | Latvia | 97.1 /100 | #84 | Exceptional 14.5% |
| Soviet Union | 97.1 /100 | #85 | Exceptional 14.5% |
| Immigrants | Argentina | 97.1 /100 | #86 | Exceptional 14.5% |
| Taiwanese | 97.1 /100 | #87 | Exceptional 14.5% |
| Northern Europeans | 97.0 /100 | #88 | Exceptional 14.5% |
| Germans | 96.9 /100 | #89 | Exceptional 14.5% |
| Austrians | 96.9 /100 | #90 | Exceptional 14.5% |
| Immigrants | North America | 96.7 /100 | #91 | Exceptional 14.6% |
| Immigrants | Italy | 96.7 /100 | #92 | Exceptional 14.6% |
| Argentineans | 96.6 /100 | #93 | Exceptional 14.6% |
| Immigrants | South Africa | 96.3 /100 | #94 | Exceptional 14.6% |
Demographics Similar to Immigrants from Norway by Child Poverty Under the Age of 16
In terms of child poverty under the age of 16, the demographic groups most similar to Immigrants from Norway are Immigrants from Malaysia (15.0%, a difference of 0.060%), Carpatho Rusyn (14.9%, a difference of 0.15%), Immigrants from Ukraine (14.9%, a difference of 0.17%), Scottish (15.0%, a difference of 0.21%), and Sri Lankan (14.9%, a difference of 0.23%).
| Demographics | Rating | Rank | Child Poverty Under the Age of 16 |
| English | 93.5 /100 | #110 | Exceptional 14.9% |
| Immigrants | Denmark | 93.5 /100 | #111 | Exceptional 14.9% |
| Irish | 93.4 /100 | #112 | Exceptional 14.9% |
| Belgians | 93.3 /100 | #113 | Exceptional 14.9% |
| Sri Lankans | 93.2 /100 | #114 | Exceptional 14.9% |
| Immigrants | Ukraine | 93.1 /100 | #115 | Exceptional 14.9% |
| Carpatho Rusyns | 93.1 /100 | #116 | Exceptional 14.9% |
| Immigrants | Norway | 92.8 /100 | #117 | Exceptional 15.0% |
| Immigrants | Malaysia | 92.6 /100 | #118 | Exceptional 15.0% |
| Scottish | 92.3 /100 | #119 | Exceptional 15.0% |
| South Africans | 92.1 /100 | #120 | Exceptional 15.0% |
| Immigrants | Zimbabwe | 92.1 /100 | #121 | Exceptional 15.0% |
| Pakistanis | 91.7 /100 | #122 | Exceptional 15.0% |
| Immigrants | Brazil | 91.1 /100 | #123 | Exceptional 15.1% |
| Czechoslovakians | 91.0 /100 | #124 | Exceptional 15.1% |