Immigrants from Bahamas vs Immigrants from Norway Per Capita Income
COMPARE
Immigrants from Bahamas
Immigrants from Norway
Per Capita Income
Per Capita Income Comparison
Immigrants from Bahamas
Immigrants from Norway
$37,193
PER CAPITA INCOME
0.1/ 100
METRIC RATING
300th/ 347
METRIC RANK
$52,217
PER CAPITA INCOME
100.0/ 100
METRIC RATING
32nd/ 347
METRIC RANK
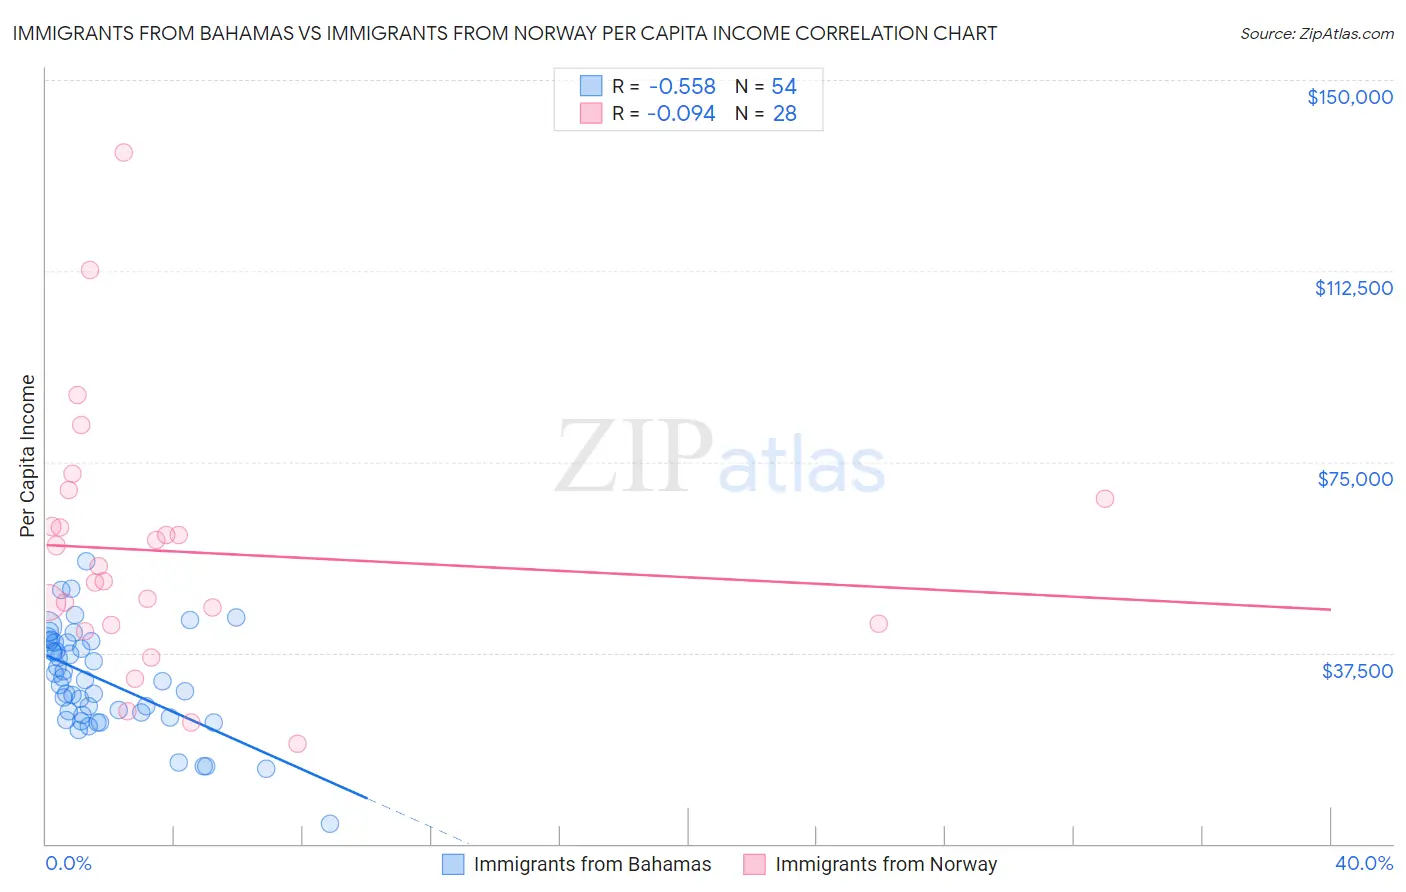
Immigrants from Bahamas vs Immigrants from Norway Per Capita Income Correlation Chart
The statistical analysis conducted on geographies consisting of 104,665,550 people shows a substantial negative correlation between the proportion of Immigrants from Bahamas and per capita income in the United States with a correlation coefficient (R) of -0.558 and weighted average of $37,193. Similarly, the statistical analysis conducted on geographies consisting of 116,714,031 people shows a slight negative correlation between the proportion of Immigrants from Norway and per capita income in the United States with a correlation coefficient (R) of -0.094 and weighted average of $52,217, a difference of 40.4%.
Per Capita Income Correlation Summary
| Measurement | Immigrants from Bahamas | Immigrants from Norway |
| Minimum | $3,864 | $19,734 |
| Maximum | $55,468 | $135,828 |
| Range | $51,604 | $116,094 |
| Mean | $32,077 | $57,343 |
| Median | $32,055 | $53,027 |
| Interquartile 25% (IQ1) | $25,247 | $43,092 |
| Interquartile 75% (IQ3) | $39,474 | $65,016 |
| Interquartile Range (IQR) | $14,227 | $21,924 |
| Standard Deviation (Sample) | $9,963 | $25,135 |
| Standard Deviation (Population) | $9,870 | $24,682 |
Similar Demographics by Per Capita Income
Demographics Similar to Immigrants from Bahamas by Per Capita Income
In terms of per capita income, the demographic groups most similar to Immigrants from Bahamas are Cherokee ($37,203, a difference of 0.030%), Immigrants from Caribbean ($37,254, a difference of 0.17%), Ottawa ($37,101, a difference of 0.25%), Haitian ($37,289, a difference of 0.26%), and Indonesian ($37,300, a difference of 0.29%).
| Demographics | Rating | Rank | Per Capita Income |
| Mexican American Indians | 0.1 /100 | #293 | Tragic $37,407 |
| Cubans | 0.1 /100 | #294 | Tragic $37,383 |
| Immigrants | Dominican Republic | 0.1 /100 | #295 | Tragic $37,306 |
| Indonesians | 0.1 /100 | #296 | Tragic $37,300 |
| Haitians | 0.1 /100 | #297 | Tragic $37,289 |
| Immigrants | Caribbean | 0.1 /100 | #298 | Tragic $37,254 |
| Cherokee | 0.1 /100 | #299 | Tragic $37,203 |
| Immigrants | Bahamas | 0.1 /100 | #300 | Tragic $37,193 |
| Ottawa | 0.1 /100 | #301 | Tragic $37,101 |
| Shoshone | 0.1 /100 | #302 | Tragic $37,072 |
| Paiute | 0.1 /100 | #303 | Tragic $37,066 |
| Hondurans | 0.1 /100 | #304 | Tragic $37,031 |
| Inupiat | 0.1 /100 | #305 | Tragic $36,999 |
| Immigrants | Haiti | 0.0 /100 | #306 | Tragic $36,849 |
| Immigrants | Latin America | 0.0 /100 | #307 | Tragic $36,823 |
Demographics Similar to Immigrants from Norway by Per Capita Income
In terms of per capita income, the demographic groups most similar to Immigrants from Norway are Australian ($52,074, a difference of 0.27%), Turkish ($52,391, a difference of 0.33%), Immigrants from Russia ($52,044, a difference of 0.33%), Burmese ($52,005, a difference of 0.41%), and Immigrants from Austria ($52,503, a difference of 0.55%).
| Demographics | Rating | Rank | Per Capita Income |
| Immigrants | Japan | 100.0 /100 | #25 | Exceptional $53,359 |
| Russians | 100.0 /100 | #26 | Exceptional $53,154 |
| Immigrants | South Central Asia | 100.0 /100 | #27 | Exceptional $52,660 |
| Latvians | 100.0 /100 | #28 | Exceptional $52,649 |
| Israelis | 100.0 /100 | #29 | Exceptional $52,596 |
| Immigrants | Austria | 100.0 /100 | #30 | Exceptional $52,503 |
| Turks | 100.0 /100 | #31 | Exceptional $52,391 |
| Immigrants | Norway | 100.0 /100 | #32 | Exceptional $52,217 |
| Australians | 100.0 /100 | #33 | Exceptional $52,074 |
| Immigrants | Russia | 100.0 /100 | #34 | Exceptional $52,044 |
| Burmese | 100.0 /100 | #35 | Exceptional $52,005 |
| Immigrants | Greece | 100.0 /100 | #36 | Exceptional $51,891 |
| Estonians | 100.0 /100 | #37 | Exceptional $51,875 |
| Immigrants | Czechoslovakia | 100.0 /100 | #38 | Exceptional $51,770 |
| Cambodians | 100.0 /100 | #39 | Exceptional $51,731 |