Immigrants from Kenya vs Arab Per Capita Income
COMPARE
Immigrants from Kenya
Arab
Per Capita Income
Per Capita Income Comparison
Immigrants from Kenya
Arabs
$42,661
PER CAPITA INCOME
24.5/ 100
METRIC RATING
195th/ 347
METRIC RANK
$45,662
PER CAPITA INCOME
90.4/ 100
METRIC RATING
130th/ 347
METRIC RANK
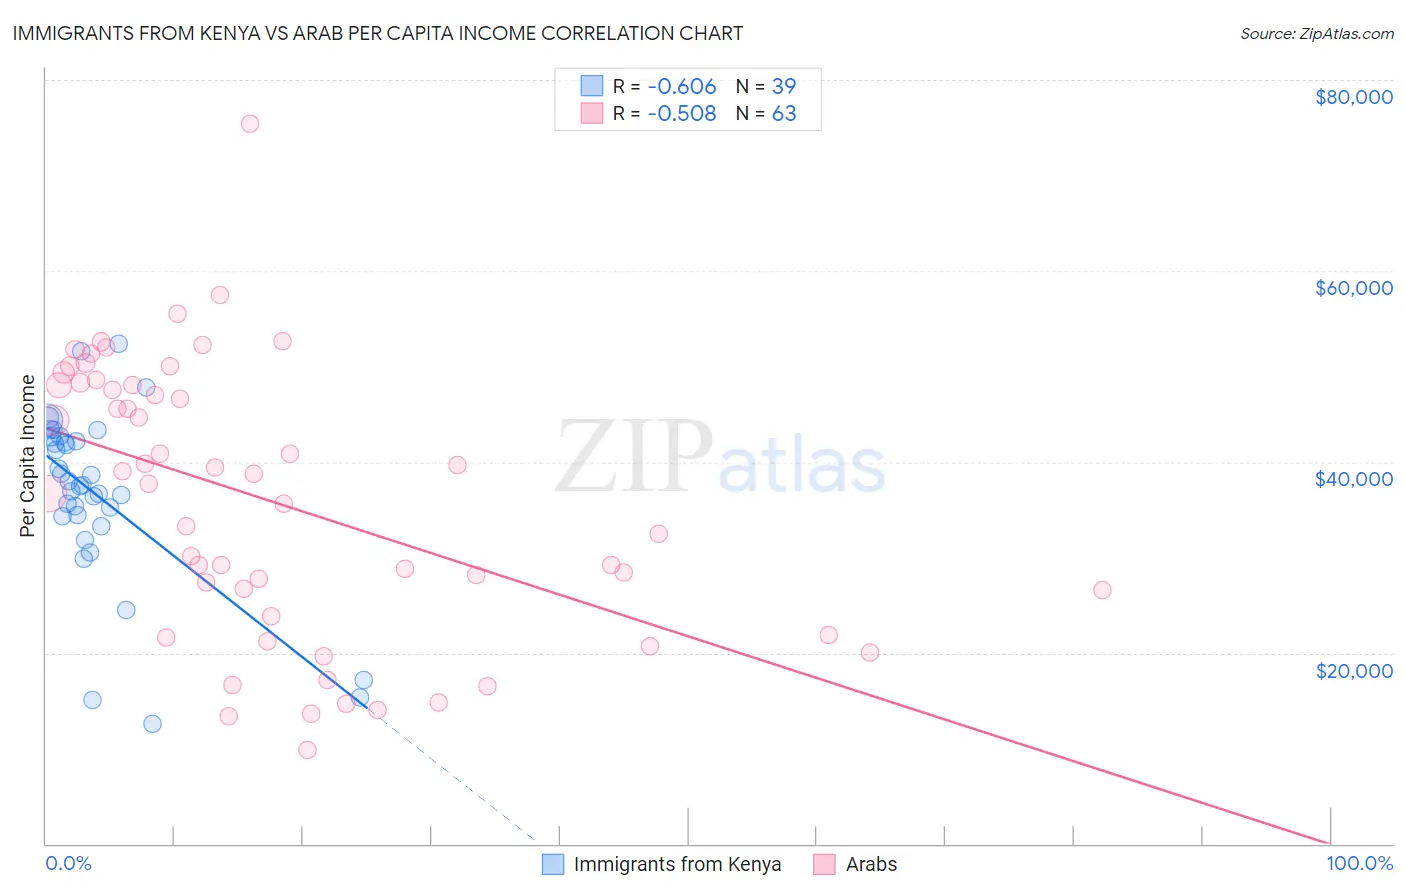
Immigrants from Kenya vs Arab Per Capita Income Correlation Chart
The statistical analysis conducted on geographies consisting of 218,088,473 people shows a significant negative correlation between the proportion of Immigrants from Kenya and per capita income in the United States with a correlation coefficient (R) of -0.606 and weighted average of $42,661. Similarly, the statistical analysis conducted on geographies consisting of 486,915,485 people shows a substantial negative correlation between the proportion of Arabs and per capita income in the United States with a correlation coefficient (R) of -0.508 and weighted average of $45,662, a difference of 7.0%.
Per Capita Income Correlation Summary
| Measurement | Immigrants from Kenya | Arab |
| Minimum | $12,576 | $9,805 |
| Maximum | $52,346 | $75,372 |
| Range | $39,770 | $65,567 |
| Mean | $36,572 | $35,873 |
| Median | $37,555 | $37,723 |
| Interquartile 25% (IQ1) | $34,356 | $23,895 |
| Interquartile 75% (IQ3) | $42,624 | $48,040 |
| Interquartile Range (IQR) | $8,268 | $24,145 |
| Standard Deviation (Sample) | $9,228 | $14,217 |
| Standard Deviation (Population) | $9,109 | $14,103 |
Similar Demographics by Per Capita Income
Demographics Similar to Immigrants from Kenya by Per Capita Income
In terms of per capita income, the demographic groups most similar to Immigrants from Kenya are Immigrants from Fiji ($42,694, a difference of 0.080%), Dutch ($42,605, a difference of 0.13%), Immigrants from Sierra Leone ($42,752, a difference of 0.21%), Iraqi ($42,760, a difference of 0.23%), and Scotch-Irish ($42,563, a difference of 0.23%).
| Demographics | Rating | Rank | Per Capita Income |
| Immigrants | Africa | 31.0 /100 | #188 | Fair $42,950 |
| Bermudans | 30.1 /100 | #189 | Fair $42,911 |
| Kenyans | 27.7 /100 | #190 | Fair $42,808 |
| Yugoslavians | 27.4 /100 | #191 | Fair $42,792 |
| Iraqis | 26.7 /100 | #192 | Fair $42,760 |
| Immigrants | Sierra Leone | 26.5 /100 | #193 | Fair $42,752 |
| Immigrants | Fiji | 25.2 /100 | #194 | Fair $42,694 |
| Immigrants | Kenya | 24.5 /100 | #195 | Fair $42,661 |
| Dutch | 23.4 /100 | #196 | Fair $42,605 |
| Scotch-Irish | 22.6 /100 | #197 | Fair $42,563 |
| Immigrants | Portugal | 19.7 /100 | #198 | Poor $42,412 |
| Barbadians | 19.6 /100 | #199 | Poor $42,406 |
| Vietnamese | 19.0 /100 | #200 | Poor $42,368 |
| Immigrants | Thailand | 17.6 /100 | #201 | Poor $42,289 |
| Immigrants | Bosnia and Herzegovina | 17.5 /100 | #202 | Poor $42,278 |
Demographics Similar to Arabs by Per Capita Income
In terms of per capita income, the demographic groups most similar to Arabs are Luxembourger ($45,663, a difference of 0.0%), Immigrants from North Macedonia ($45,622, a difference of 0.090%), Jordanian ($45,605, a difference of 0.12%), Pakistani ($45,587, a difference of 0.16%), and Slovene ($45,581, a difference of 0.18%).
| Demographics | Rating | Rank | Per Capita Income |
| Lebanese | 92.0 /100 | #123 | Exceptional $45,840 |
| Europeans | 92.0 /100 | #124 | Exceptional $45,836 |
| Zimbabweans | 91.7 /100 | #125 | Exceptional $45,804 |
| Palestinians | 91.6 /100 | #126 | Exceptional $45,790 |
| Immigrants | Germany | 91.3 /100 | #127 | Exceptional $45,751 |
| Swedes | 91.3 /100 | #128 | Exceptional $45,750 |
| Luxembourgers | 90.4 /100 | #129 | Exceptional $45,663 |
| Arabs | 90.4 /100 | #130 | Exceptional $45,662 |
| Immigrants | North Macedonia | 90.0 /100 | #131 | Exceptional $45,622 |
| Jordanians | 89.9 /100 | #132 | Excellent $45,605 |
| Pakistanis | 89.7 /100 | #133 | Excellent $45,587 |
| Slovenes | 89.6 /100 | #134 | Excellent $45,581 |
| Hungarians | 87.9 /100 | #135 | Excellent $45,426 |
| Immigrants | Oceania | 85.2 /100 | #136 | Excellent $45,220 |
| Immigrants | Syria | 85.2 /100 | #137 | Excellent $45,218 |