Syrian vs Moroccan Per Capita Income
COMPARE
Syrian
Moroccan
Per Capita Income
Per Capita Income Comparison
Syrians
Moroccans
$46,837
PER CAPITA INCOME
97.2/ 100
METRIC RATING
103rd/ 347
METRIC RANK
$45,854
PER CAPITA INCOME
92.1/ 100
METRIC RATING
122nd/ 347
METRIC RANK
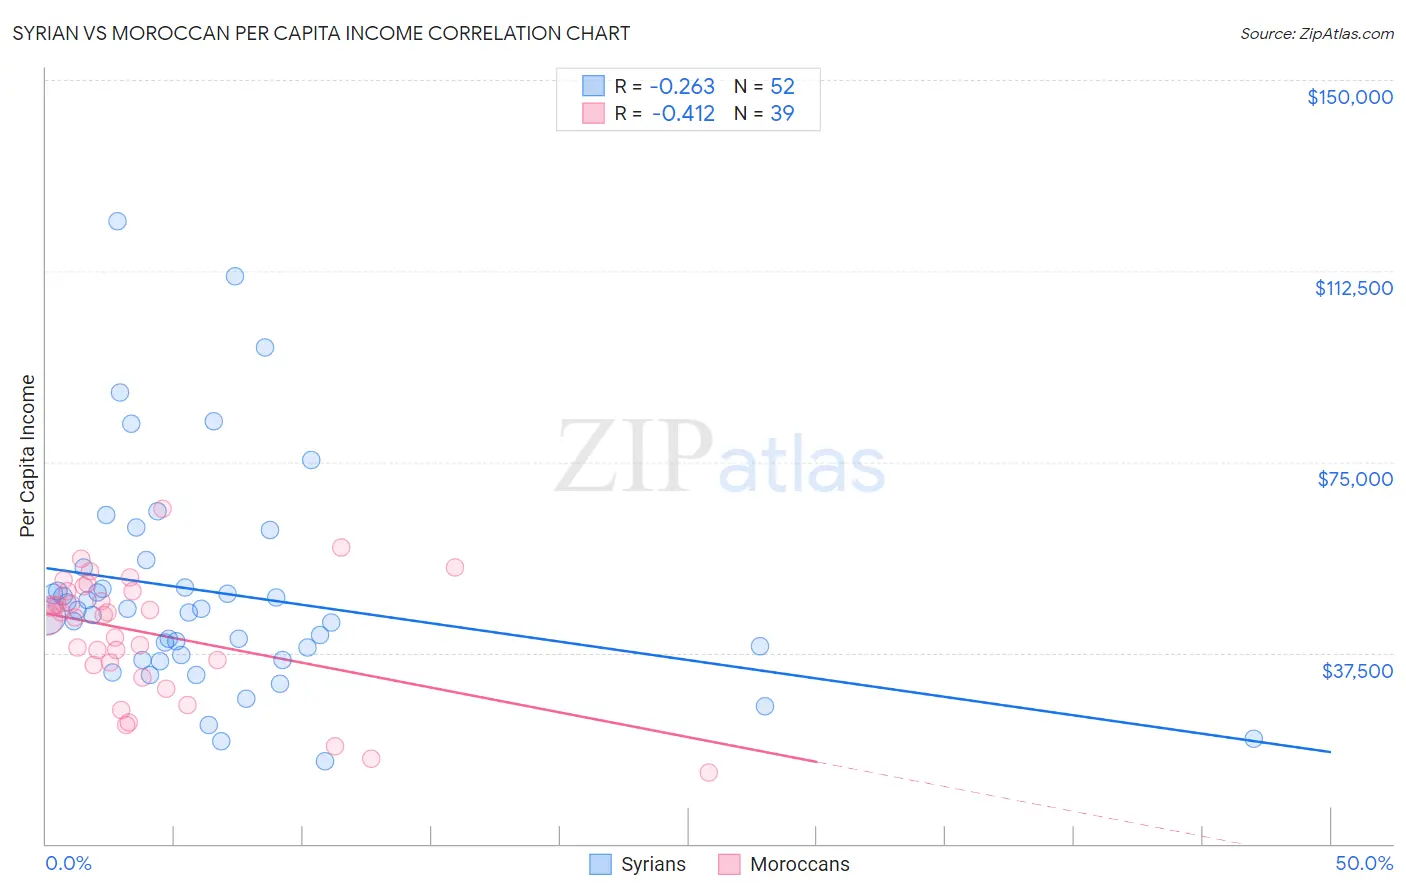
Syrian vs Moroccan Per Capita Income Correlation Chart
The statistical analysis conducted on geographies consisting of 266,332,251 people shows a weak negative correlation between the proportion of Syrians and per capita income in the United States with a correlation coefficient (R) of -0.263 and weighted average of $46,837. Similarly, the statistical analysis conducted on geographies consisting of 201,819,214 people shows a moderate negative correlation between the proportion of Moroccans and per capita income in the United States with a correlation coefficient (R) of -0.412 and weighted average of $45,854, a difference of 2.1%.
Per Capita Income Correlation Summary
| Measurement | Syrian | Moroccan |
| Minimum | $16,296 | $14,047 |
| Maximum | $122,379 | $65,725 |
| Range | $106,083 | $51,678 |
| Mean | $49,326 | $41,336 |
| Median | $45,708 | $44,873 |
| Interquartile 25% (IQ1) | $36,580 | $35,130 |
| Interquartile 75% (IQ3) | $52,298 | $49,634 |
| Interquartile Range (IQR) | $15,717 | $14,504 |
| Standard Deviation (Sample) | $21,603 | $11,952 |
| Standard Deviation (Population) | $21,394 | $11,797 |
Demographics Similar to Syrians and Moroccans by Per Capita Income
In terms of per capita income, the demographic groups most similar to Syrians are Immigrants from Western Asia ($46,876, a difference of 0.080%), Brazilian ($46,700, a difference of 0.29%), British ($46,571, a difference of 0.57%), Ethiopian ($46,569, a difference of 0.57%), and Serbian ($46,551, a difference of 0.61%). Similarly, the demographic groups most similar to Moroccans are Canadian ($45,858, a difference of 0.010%), Immigrants from Ethiopia ($45,923, a difference of 0.15%), Immigrants from Poland ($45,979, a difference of 0.27%), Immigrants from Saudi Arabia ($46,008, a difference of 0.34%), and Chinese ($46,098, a difference of 0.53%).
| Demographics | Rating | Rank | Per Capita Income |
| Immigrants | Western Asia | 97.4 /100 | #102 | Exceptional $46,876 |
| Syrians | 97.2 /100 | #103 | Exceptional $46,837 |
| Brazilians | 96.8 /100 | #104 | Exceptional $46,700 |
| British | 96.3 /100 | #105 | Exceptional $46,571 |
| Ethiopians | 96.3 /100 | #106 | Exceptional $46,569 |
| Serbians | 96.2 /100 | #107 | Exceptional $46,551 |
| Immigrants | Kuwait | 96.2 /100 | #108 | Exceptional $46,543 |
| Immigrants | Northern Africa | 96.2 /100 | #109 | Exceptional $46,531 |
| Chileans | 95.9 /100 | #110 | Exceptional $46,459 |
| Taiwanese | 95.8 /100 | #111 | Exceptional $46,455 |
| Immigrants | Morocco | 95.7 /100 | #112 | Exceptional $46,430 |
| Immigrants | Albania | 95.5 /100 | #113 | Exceptional $46,387 |
| Afghans | 94.9 /100 | #114 | Exceptional $46,268 |
| Immigrants | Chile | 94.6 /100 | #115 | Exceptional $46,213 |
| Poles | 94.1 /100 | #116 | Exceptional $46,123 |
| Chinese | 93.9 /100 | #117 | Exceptional $46,098 |
| Immigrants | Saudi Arabia | 93.3 /100 | #118 | Exceptional $46,008 |
| Immigrants | Poland | 93.1 /100 | #119 | Exceptional $45,979 |
| Immigrants | Ethiopia | 92.7 /100 | #120 | Exceptional $45,923 |
| Canadians | 92.2 /100 | #121 | Exceptional $45,858 |
| Moroccans | 92.1 /100 | #122 | Exceptional $45,854 |