Central American Indian vs Moroccan Per Capita Income
COMPARE
Central American Indian
Moroccan
Per Capita Income
Per Capita Income Comparison
Central American Indians
Moroccans
$37,699
PER CAPITA INCOME
0.1/ 100
METRIC RATING
286th/ 347
METRIC RANK
$45,854
PER CAPITA INCOME
92.1/ 100
METRIC RATING
122nd/ 347
METRIC RANK
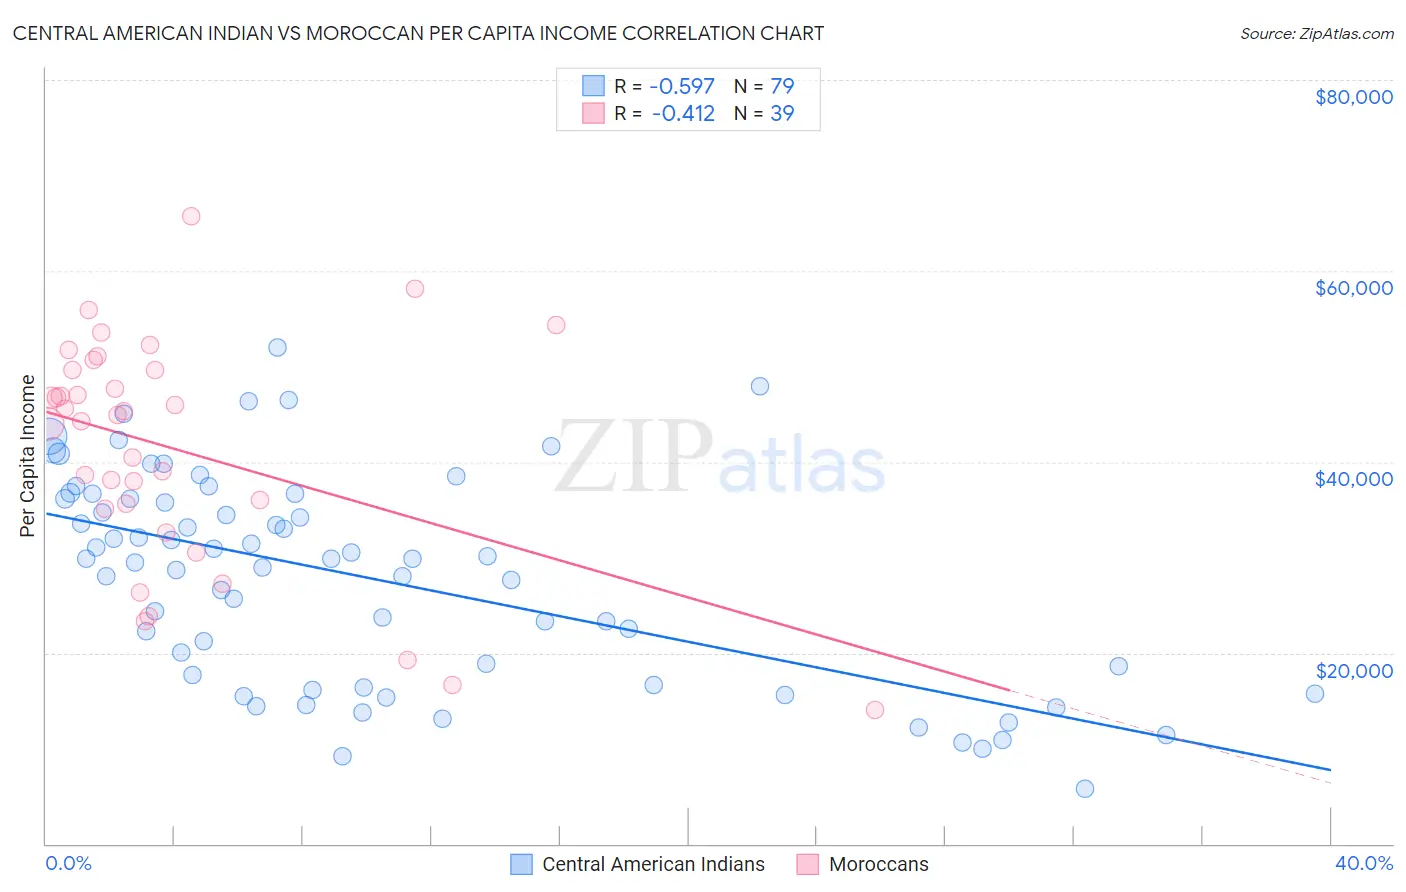
Central American Indian vs Moroccan Per Capita Income Correlation Chart
The statistical analysis conducted on geographies consisting of 326,146,034 people shows a substantial negative correlation between the proportion of Central American Indians and per capita income in the United States with a correlation coefficient (R) of -0.597 and weighted average of $37,699. Similarly, the statistical analysis conducted on geographies consisting of 201,819,214 people shows a moderate negative correlation between the proportion of Moroccans and per capita income in the United States with a correlation coefficient (R) of -0.412 and weighted average of $45,854, a difference of 21.6%.
Per Capita Income Correlation Summary
| Measurement | Central American Indian | Moroccan |
| Minimum | $5,814 | $14,047 |
| Maximum | $51,916 | $65,725 |
| Range | $46,102 | $51,678 |
| Mean | $27,773 | $41,336 |
| Median | $29,805 | $44,873 |
| Interquartile 25% (IQ1) | $16,640 | $35,130 |
| Interquartile 75% (IQ3) | $36,169 | $49,634 |
| Interquartile Range (IQR) | $19,529 | $14,504 |
| Standard Deviation (Sample) | $10,964 | $11,952 |
| Standard Deviation (Population) | $10,894 | $11,797 |
Similar Demographics by Per Capita Income
Demographics Similar to Central American Indians by Per Capita Income
In terms of per capita income, the demographic groups most similar to Central American Indians are Dominican ($37,697, a difference of 0.010%), Blackfeet ($37,695, a difference of 0.010%), Guatemalan ($37,766, a difference of 0.18%), African ($37,785, a difference of 0.23%), and U.S. Virgin Islander ($37,589, a difference of 0.29%).
| Demographics | Rating | Rank | Per Capita Income |
| Colville | 0.2 /100 | #279 | Tragic $38,047 |
| Potawatomi | 0.2 /100 | #280 | Tragic $38,046 |
| Immigrants | Dominica | 0.2 /100 | #281 | Tragic $37,952 |
| Immigrants | Laos | 0.1 /100 | #282 | Tragic $37,857 |
| Pennsylvania Germans | 0.1 /100 | #283 | Tragic $37,842 |
| Africans | 0.1 /100 | #284 | Tragic $37,785 |
| Guatemalans | 0.1 /100 | #285 | Tragic $37,766 |
| Central American Indians | 0.1 /100 | #286 | Tragic $37,699 |
| Dominicans | 0.1 /100 | #287 | Tragic $37,697 |
| Blackfeet | 0.1 /100 | #288 | Tragic $37,695 |
| U.S. Virgin Islanders | 0.1 /100 | #289 | Tragic $37,589 |
| Immigrants | Guatemala | 0.1 /100 | #290 | Tragic $37,550 |
| Cajuns | 0.1 /100 | #291 | Tragic $37,527 |
| Immigrants | Micronesia | 0.1 /100 | #292 | Tragic $37,464 |
| Mexican American Indians | 0.1 /100 | #293 | Tragic $37,407 |
Demographics Similar to Moroccans by Per Capita Income
In terms of per capita income, the demographic groups most similar to Moroccans are Canadian ($45,858, a difference of 0.010%), Lebanese ($45,840, a difference of 0.030%), European ($45,836, a difference of 0.040%), Zimbabwean ($45,804, a difference of 0.11%), and Palestinian ($45,790, a difference of 0.14%).
| Demographics | Rating | Rank | Per Capita Income |
| Immigrants | Chile | 94.6 /100 | #115 | Exceptional $46,213 |
| Poles | 94.1 /100 | #116 | Exceptional $46,123 |
| Chinese | 93.9 /100 | #117 | Exceptional $46,098 |
| Immigrants | Saudi Arabia | 93.3 /100 | #118 | Exceptional $46,008 |
| Immigrants | Poland | 93.1 /100 | #119 | Exceptional $45,979 |
| Immigrants | Ethiopia | 92.7 /100 | #120 | Exceptional $45,923 |
| Canadians | 92.2 /100 | #121 | Exceptional $45,858 |
| Moroccans | 92.1 /100 | #122 | Exceptional $45,854 |
| Lebanese | 92.0 /100 | #123 | Exceptional $45,840 |
| Europeans | 92.0 /100 | #124 | Exceptional $45,836 |
| Zimbabweans | 91.7 /100 | #125 | Exceptional $45,804 |
| Palestinians | 91.6 /100 | #126 | Exceptional $45,790 |
| Immigrants | Germany | 91.3 /100 | #127 | Exceptional $45,751 |
| Swedes | 91.3 /100 | #128 | Exceptional $45,750 |
| Luxembourgers | 90.4 /100 | #129 | Exceptional $45,663 |