Native Hawaiian vs Moroccan Per Capita Income
COMPARE
Native Hawaiian
Moroccan
Per Capita Income
Per Capita Income Comparison
Native Hawaiians
Moroccans
$41,017
PER CAPITA INCOME
4.9/ 100
METRIC RATING
230th/ 347
METRIC RANK
$45,854
PER CAPITA INCOME
92.1/ 100
METRIC RATING
122nd/ 347
METRIC RANK
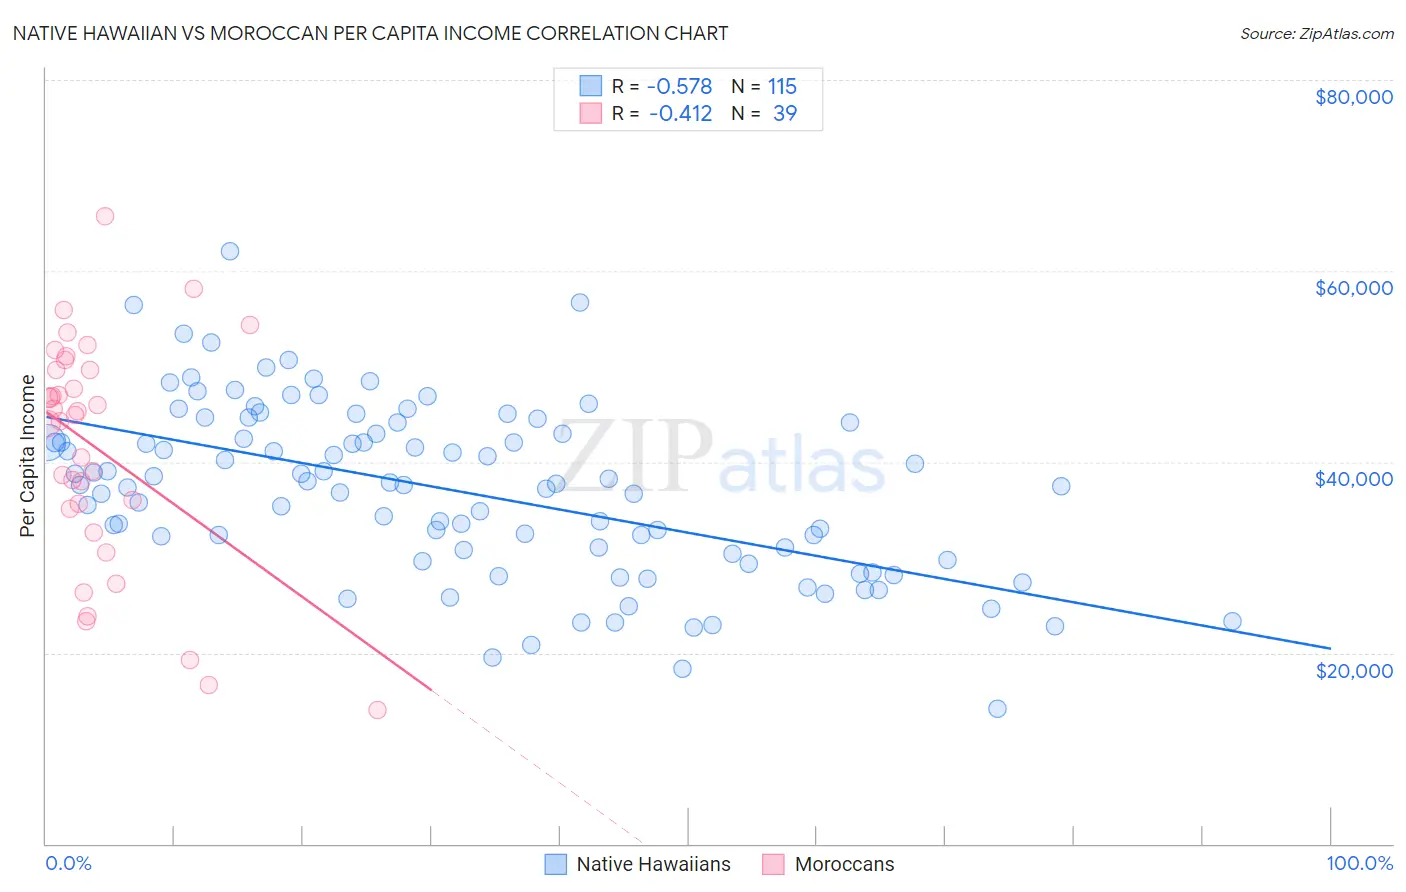
Native Hawaiian vs Moroccan Per Capita Income Correlation Chart
The statistical analysis conducted on geographies consisting of 332,135,115 people shows a substantial negative correlation between the proportion of Native Hawaiians and per capita income in the United States with a correlation coefficient (R) of -0.578 and weighted average of $41,017. Similarly, the statistical analysis conducted on geographies consisting of 201,819,214 people shows a moderate negative correlation between the proportion of Moroccans and per capita income in the United States with a correlation coefficient (R) of -0.412 and weighted average of $45,854, a difference of 11.8%.
Per Capita Income Correlation Summary
| Measurement | Native Hawaiian | Moroccan |
| Minimum | $14,082 | $14,047 |
| Maximum | $62,011 | $65,725 |
| Range | $47,929 | $51,678 |
| Mean | $36,984 | $41,336 |
| Median | $37,623 | $44,873 |
| Interquartile 25% (IQ1) | $30,336 | $35,130 |
| Interquartile 75% (IQ3) | $42,931 | $49,634 |
| Interquartile Range (IQR) | $12,595 | $14,504 |
| Standard Deviation (Sample) | $9,013 | $11,952 |
| Standard Deviation (Population) | $8,974 | $11,797 |
Similar Demographics by Per Capita Income
Demographics Similar to Native Hawaiians by Per Capita Income
In terms of per capita income, the demographic groups most similar to Native Hawaiians are Nigerian ($41,026, a difference of 0.020%), Senegalese ($41,000, a difference of 0.040%), Guyanese ($40,949, a difference of 0.16%), Immigrants from Grenada ($41,123, a difference of 0.26%), and Immigrants from Ghana ($41,131, a difference of 0.28%).
| Demographics | Rating | Rank | Per Capita Income |
| Immigrants | Cameroon | 6.8 /100 | #223 | Tragic $41,334 |
| Immigrants | St. Vincent and the Grenadines | 6.4 /100 | #224 | Tragic $41,270 |
| West Indians | 6.0 /100 | #225 | Tragic $41,217 |
| Immigrants | Ecuador | 5.9 /100 | #226 | Tragic $41,195 |
| Immigrants | Ghana | 5.5 /100 | #227 | Tragic $41,131 |
| Immigrants | Grenada | 5.5 /100 | #228 | Tragic $41,123 |
| Nigerians | 4.9 /100 | #229 | Tragic $41,026 |
| Native Hawaiians | 4.9 /100 | #230 | Tragic $41,017 |
| Senegalese | 4.8 /100 | #231 | Tragic $41,000 |
| Guyanese | 4.5 /100 | #232 | Tragic $40,949 |
| Delaware | 3.8 /100 | #233 | Tragic $40,778 |
| Immigrants | West Indies | 3.7 /100 | #234 | Tragic $40,763 |
| Immigrants | Guyana | 3.6 /100 | #235 | Tragic $40,742 |
| Immigrants | Nonimmigrants | 3.4 /100 | #236 | Tragic $40,669 |
| Immigrants | Cambodia | 2.6 /100 | #237 | Tragic $40,434 |
Demographics Similar to Moroccans by Per Capita Income
In terms of per capita income, the demographic groups most similar to Moroccans are Canadian ($45,858, a difference of 0.010%), Lebanese ($45,840, a difference of 0.030%), European ($45,836, a difference of 0.040%), Zimbabwean ($45,804, a difference of 0.11%), and Palestinian ($45,790, a difference of 0.14%).
| Demographics | Rating | Rank | Per Capita Income |
| Immigrants | Chile | 94.6 /100 | #115 | Exceptional $46,213 |
| Poles | 94.1 /100 | #116 | Exceptional $46,123 |
| Chinese | 93.9 /100 | #117 | Exceptional $46,098 |
| Immigrants | Saudi Arabia | 93.3 /100 | #118 | Exceptional $46,008 |
| Immigrants | Poland | 93.1 /100 | #119 | Exceptional $45,979 |
| Immigrants | Ethiopia | 92.7 /100 | #120 | Exceptional $45,923 |
| Canadians | 92.2 /100 | #121 | Exceptional $45,858 |
| Moroccans | 92.1 /100 | #122 | Exceptional $45,854 |
| Lebanese | 92.0 /100 | #123 | Exceptional $45,840 |
| Europeans | 92.0 /100 | #124 | Exceptional $45,836 |
| Zimbabweans | 91.7 /100 | #125 | Exceptional $45,804 |
| Palestinians | 91.6 /100 | #126 | Exceptional $45,790 |
| Immigrants | Germany | 91.3 /100 | #127 | Exceptional $45,751 |
| Swedes | 91.3 /100 | #128 | Exceptional $45,750 |
| Luxembourgers | 90.4 /100 | #129 | Exceptional $45,663 |