Syrian vs Jordanian GED/Equivalency
COMPARE
Syrian
Jordanian
GED/Equivalency
GED/Equivalency Comparison
Syrians
Jordanians
87.2%
GED/EQUIVALENCY
96.6/ 100
METRIC RATING
101st/ 347
METRIC RANK
87.2%
GED/EQUIVALENCY
96.1/ 100
METRIC RATING
103rd/ 347
METRIC RANK
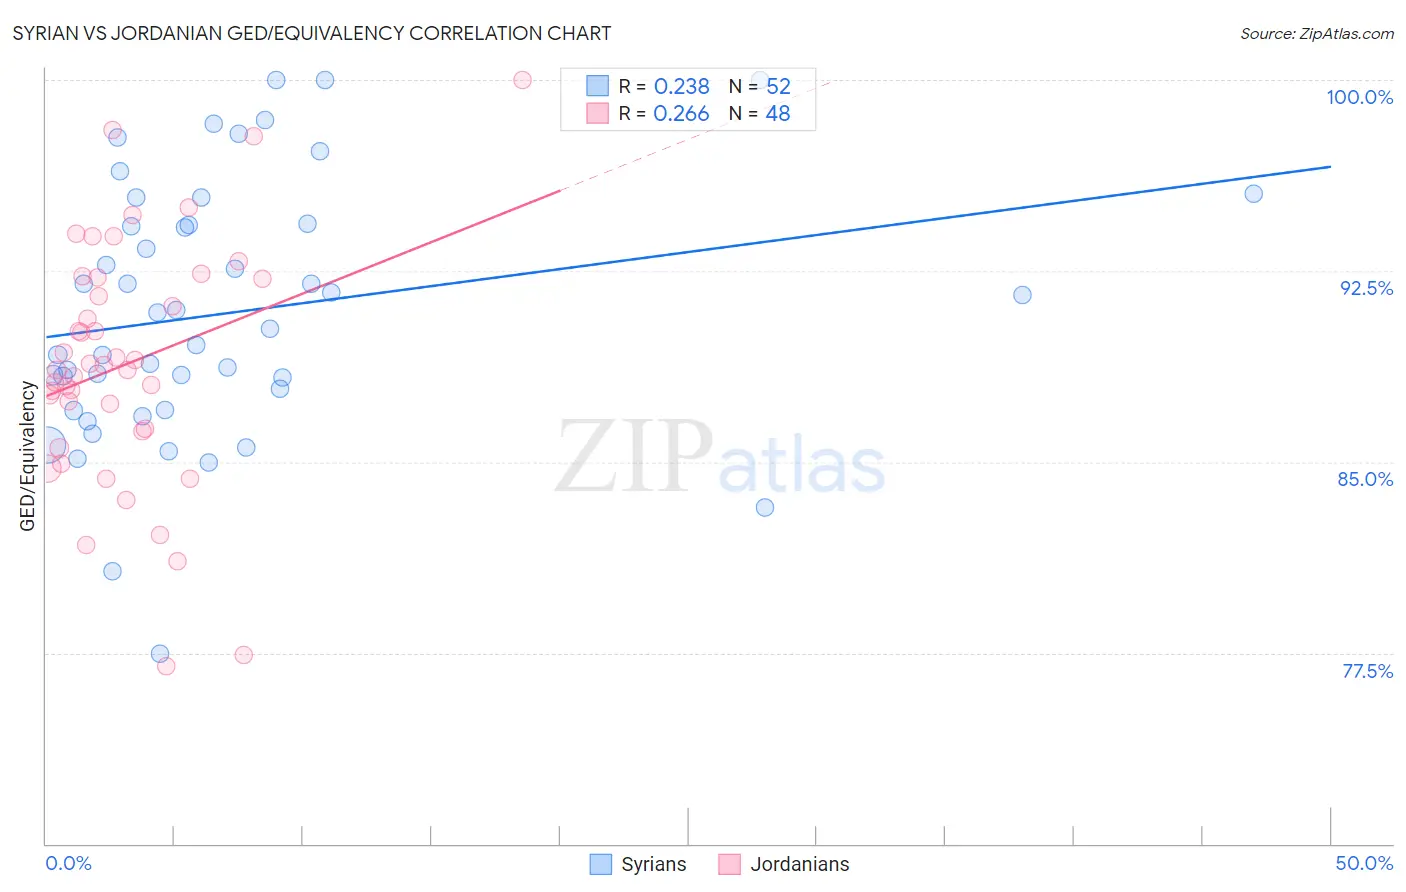
Syrian vs Jordanian GED/Equivalency Correlation Chart
The statistical analysis conducted on geographies consisting of 266,306,452 people shows a weak positive correlation between the proportion of Syrians and percentage of population with at least ged/equivalency education in the United States with a correlation coefficient (R) of 0.238 and weighted average of 87.2%. Similarly, the statistical analysis conducted on geographies consisting of 166,422,962 people shows a weak positive correlation between the proportion of Jordanians and percentage of population with at least ged/equivalency education in the United States with a correlation coefficient (R) of 0.266 and weighted average of 87.2%, a difference of 0.070%.
GED/Equivalency Correlation Summary
| Measurement | Syrian | Jordanian |
| Minimum | 77.5% | 77.0% |
| Maximum | 100.0% | 100.0% |
| Range | 22.5% | 23.0% |
| Mean | 90.9% | 88.8% |
| Median | 90.6% | 88.7% |
| Interquartile 25% (IQ1) | 87.4% | 86.3% |
| Interquartile 75% (IQ3) | 94.3% | 92.2% |
| Interquartile Range (IQR) | 6.9% | 6.0% |
| Standard Deviation (Sample) | 5.0% | 4.8% |
| Standard Deviation (Population) | 5.0% | 4.8% |
Demographics Similar to Syrians and Jordanians by GED/Equivalency
In terms of ged/equivalency, the demographic groups most similar to Syrians are Palestinian (87.3%, a difference of 0.030%), Immigrants from Belarus (87.3%, a difference of 0.050%), Immigrants from Croatia (87.3%, a difference of 0.060%), Lebanese (87.2%, a difference of 0.060%), and Immigrants from Hungary (87.2%, a difference of 0.080%). Similarly, the demographic groups most similar to Jordanians are Lebanese (87.2%, a difference of 0.010%), Immigrants from Hungary (87.2%, a difference of 0.010%), Indian (Asian) (87.1%, a difference of 0.020%), Immigrants from Zimbabwe (87.1%, a difference of 0.040%), and Icelander (87.1%, a difference of 0.050%).
| Demographics | Rating | Rank | GED/Equivalency |
| Israelis | 97.8 /100 | #92 | Exceptional 87.4% |
| Immigrants | North Macedonia | 97.8 /100 | #93 | Exceptional 87.4% |
| Immigrants | Russia | 97.8 /100 | #94 | Exceptional 87.4% |
| Immigrants | Greece | 97.7 /100 | #95 | Exceptional 87.4% |
| Czechoslovakians | 97.6 /100 | #96 | Exceptional 87.4% |
| Immigrants | Western Europe | 97.3 /100 | #97 | Exceptional 87.3% |
| Immigrants | Croatia | 96.9 /100 | #98 | Exceptional 87.3% |
| Immigrants | Belarus | 96.9 /100 | #99 | Exceptional 87.3% |
| Palestinians | 96.8 /100 | #100 | Exceptional 87.3% |
| Syrians | 96.6 /100 | #101 | Exceptional 87.2% |
| Lebanese | 96.2 /100 | #102 | Exceptional 87.2% |
| Jordanians | 96.1 /100 | #103 | Exceptional 87.2% |
| Immigrants | Hungary | 96.0 /100 | #104 | Exceptional 87.2% |
| Indians (Asian) | 95.9 /100 | #105 | Exceptional 87.1% |
| Immigrants | Zimbabwe | 95.8 /100 | #106 | Exceptional 87.1% |
| Icelanders | 95.7 /100 | #107 | Exceptional 87.1% |
| Canadians | 95.6 /100 | #108 | Exceptional 87.1% |
| Immigrants | Eastern Europe | 95.5 /100 | #109 | Exceptional 87.1% |
| Egyptians | 95.3 /100 | #110 | Exceptional 87.1% |
| French | 95.2 /100 | #111 | Exceptional 87.1% |
| Tlingit-Haida | 94.8 /100 | #112 | Exceptional 87.0% |