Syrian vs Hispanic or Latino Householder Income Over 65 years
COMPARE
Syrian
Hispanic or Latino
Householder Income Over 65 years
Householder Income Over 65 years Comparison
Syrians
Hispanics or Latinos
$63,494
HOUSEHOLDER INCOME OVER 65 YEARS
93.4/ 100
METRIC RATING
112th/ 347
METRIC RANK
$52,832
HOUSEHOLDER INCOME OVER 65 YEARS
0.0/ 100
METRIC RATING
307th/ 347
METRIC RANK
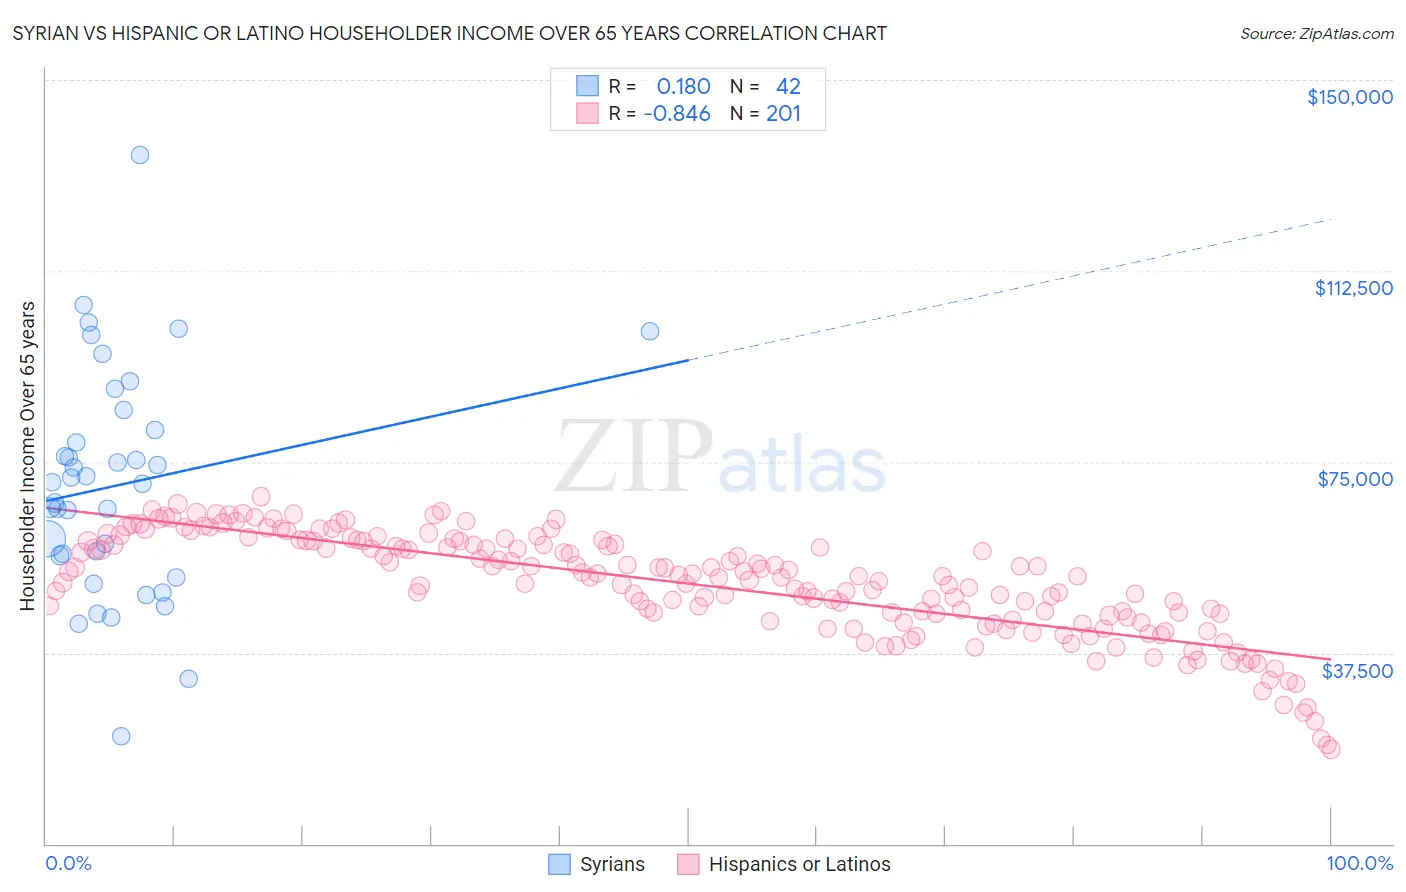
Syrian vs Hispanic or Latino Householder Income Over 65 years Correlation Chart
The statistical analysis conducted on geographies consisting of 265,818,751 people shows a poor positive correlation between the proportion of Syrians and household income with householder over the age of 65 in the United States with a correlation coefficient (R) of 0.180 and weighted average of $63,494. Similarly, the statistical analysis conducted on geographies consisting of 572,369,313 people shows a very strong negative correlation between the proportion of Hispanics or Latinos and household income with householder over the age of 65 in the United States with a correlation coefficient (R) of -0.846 and weighted average of $52,832, a difference of 20.2%.
Householder Income Over 65 years Correlation Summary
| Measurement | Syrian | Hispanic or Latino |
| Minimum | $21,115 | $18,538 |
| Maximum | $135,278 | $68,171 |
| Range | $114,162 | $49,633 |
| Mean | $70,420 | $51,010 |
| Median | $70,855 | $52,570 |
| Interquartile 25% (IQ1) | $56,590 | $44,659 |
| Interquartile 75% (IQ3) | $81,250 | $59,438 |
| Interquartile Range (IQR) | $24,660 | $14,779 |
| Standard Deviation (Sample) | $22,192 | $10,248 |
| Standard Deviation (Population) | $21,926 | $10,222 |
Similar Demographics by Householder Income Over 65 years
Demographics Similar to Syrians by Householder Income Over 65 years
In terms of householder income over 65 years, the demographic groups most similar to Syrians are Immigrants from Spain ($63,540, a difference of 0.070%), Immigrants from Serbia ($63,387, a difference of 0.17%), Immigrants from Saudi Arabia ($63,355, a difference of 0.22%), Immigrants from Zimbabwe ($63,643, a difference of 0.24%), and Croatian ($63,225, a difference of 0.43%).
| Demographics | Rating | Rank | Householder Income Over 65 years |
| Italians | 95.5 /100 | #105 | Exceptional $63,885 |
| Immigrants | Argentina | 95.5 /100 | #106 | Exceptional $63,885 |
| Pakistanis | 95.3 /100 | #107 | Exceptional $63,844 |
| Palestinians | 95.1 /100 | #108 | Exceptional $63,800 |
| Europeans | 95.0 /100 | #109 | Exceptional $63,779 |
| Immigrants | Zimbabwe | 94.3 /100 | #110 | Exceptional $63,643 |
| Immigrants | Spain | 93.7 /100 | #111 | Exceptional $63,540 |
| Syrians | 93.4 /100 | #112 | Exceptional $63,494 |
| Immigrants | Serbia | 92.7 /100 | #113 | Exceptional $63,387 |
| Immigrants | Saudi Arabia | 92.4 /100 | #114 | Exceptional $63,355 |
| Croatians | 91.4 /100 | #115 | Exceptional $63,225 |
| Guamanians/Chamorros | 91.1 /100 | #116 | Exceptional $63,187 |
| Immigrants | Croatia | 90.9 /100 | #117 | Exceptional $63,168 |
| Danes | 90.5 /100 | #118 | Exceptional $63,117 |
| Immigrants | Jordan | 89.8 /100 | #119 | Excellent $63,041 |
Demographics Similar to Hispanics or Latinos by Householder Income Over 65 years
In terms of householder income over 65 years, the demographic groups most similar to Hispanics or Latinos are Immigrants from Mexico ($52,801, a difference of 0.060%), Pennsylvania German ($52,888, a difference of 0.11%), Pueblo ($52,930, a difference of 0.19%), Ute ($52,949, a difference of 0.22%), and Honduran ($52,634, a difference of 0.38%).
| Demographics | Rating | Rank | Householder Income Over 65 years |
| Immigrants | Bahamas | 0.0 /100 | #300 | Tragic $53,174 |
| Yuman | 0.0 /100 | #301 | Tragic $53,110 |
| Spanish American Indians | 0.0 /100 | #302 | Tragic $53,077 |
| Choctaw | 0.0 /100 | #303 | Tragic $53,060 |
| Ute | 0.0 /100 | #304 | Tragic $52,949 |
| Pueblo | 0.0 /100 | #305 | Tragic $52,930 |
| Pennsylvania Germans | 0.0 /100 | #306 | Tragic $52,888 |
| Hispanics or Latinos | 0.0 /100 | #307 | Tragic $52,832 |
| Immigrants | Mexico | 0.0 /100 | #308 | Tragic $52,801 |
| Hondurans | 0.0 /100 | #309 | Tragic $52,634 |
| Sioux | 0.0 /100 | #310 | Tragic $52,509 |
| Seminole | 0.0 /100 | #311 | Tragic $52,373 |
| Immigrants | Azores | 0.0 /100 | #312 | Tragic $52,121 |
| Immigrants | Nicaragua | 0.0 /100 | #313 | Tragic $52,085 |
| Natives/Alaskans | 0.0 /100 | #314 | Tragic $52,081 |