Syrian vs Immigrants from Eastern Asia Householder Income Over 65 years
COMPARE
Syrian
Immigrants from Eastern Asia
Householder Income Over 65 years
Householder Income Over 65 years Comparison
Syrians
Immigrants from Eastern Asia
$63,494
HOUSEHOLDER INCOME OVER 65 YEARS
93.4/ 100
METRIC RATING
112th/ 347
METRIC RANK
$69,872
HOUSEHOLDER INCOME OVER 65 YEARS
100.0/ 100
METRIC RATING
21st/ 347
METRIC RANK
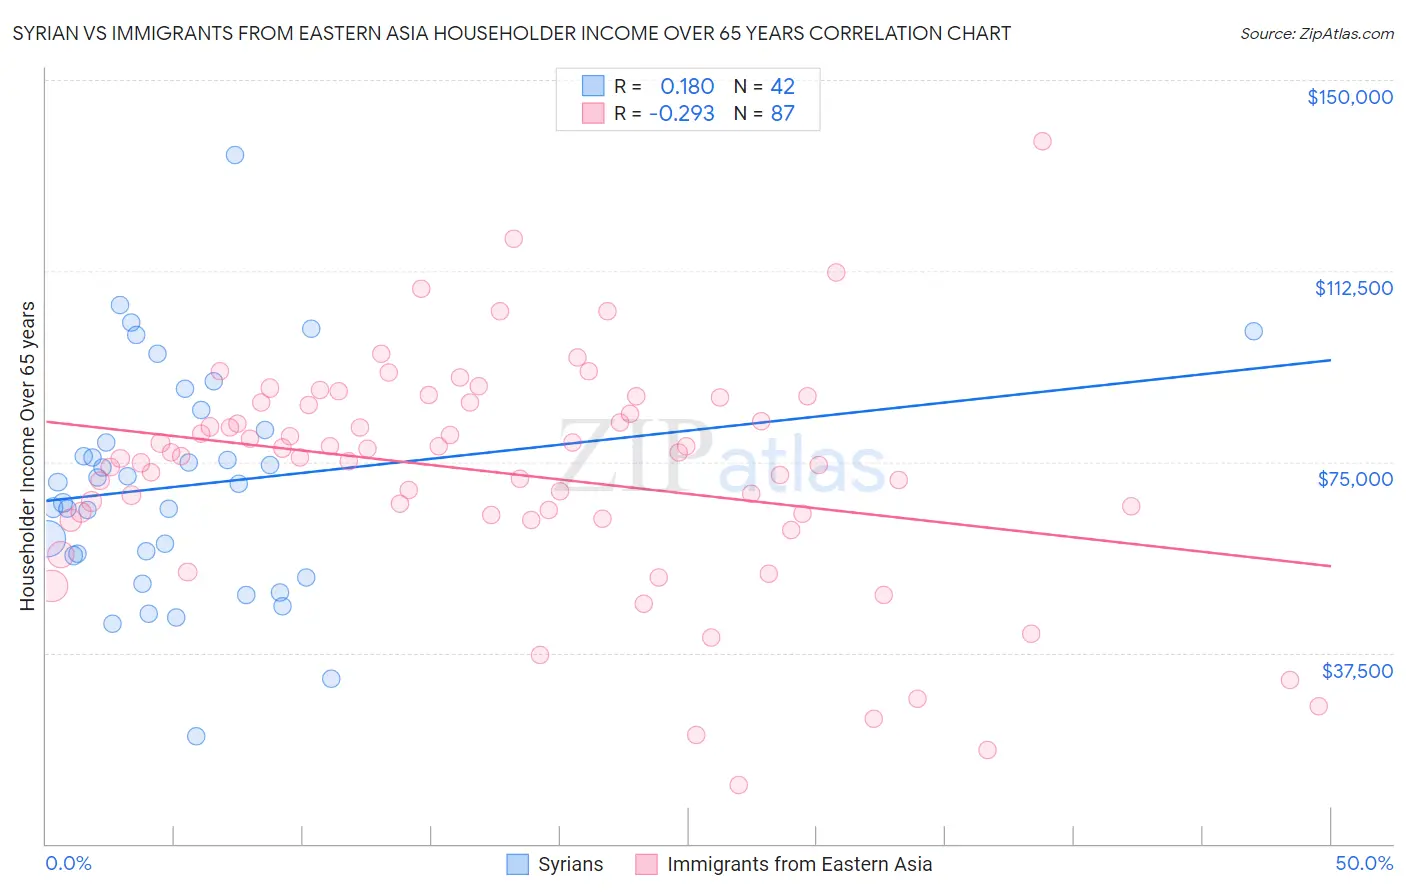
Syrian vs Immigrants from Eastern Asia Householder Income Over 65 years Correlation Chart
The statistical analysis conducted on geographies consisting of 265,818,751 people shows a poor positive correlation between the proportion of Syrians and household income with householder over the age of 65 in the United States with a correlation coefficient (R) of 0.180 and weighted average of $63,494. Similarly, the statistical analysis conducted on geographies consisting of 497,045,213 people shows a weak negative correlation between the proportion of Immigrants from Eastern Asia and household income with householder over the age of 65 in the United States with a correlation coefficient (R) of -0.293 and weighted average of $69,872, a difference of 10.1%.
Householder Income Over 65 years Correlation Summary
| Measurement | Syrian | Immigrants from Eastern Asia |
| Minimum | $21,115 | $11,563 |
| Maximum | $135,278 | $137,919 |
| Range | $114,162 | $126,356 |
| Mean | $70,420 | $72,808 |
| Median | $70,855 | $76,112 |
| Interquartile 25% (IQ1) | $56,590 | $64,522 |
| Interquartile 75% (IQ3) | $81,250 | $86,562 |
| Interquartile Range (IQR) | $24,660 | $22,039 |
| Standard Deviation (Sample) | $22,192 | $22,168 |
| Standard Deviation (Population) | $21,926 | $22,041 |
Similar Demographics by Householder Income Over 65 years
Demographics Similar to Syrians by Householder Income Over 65 years
In terms of householder income over 65 years, the demographic groups most similar to Syrians are Immigrants from Spain ($63,540, a difference of 0.070%), Immigrants from Serbia ($63,387, a difference of 0.17%), Immigrants from Saudi Arabia ($63,355, a difference of 0.22%), Immigrants from Zimbabwe ($63,643, a difference of 0.24%), and Croatian ($63,225, a difference of 0.43%).
| Demographics | Rating | Rank | Householder Income Over 65 years |
| Italians | 95.5 /100 | #105 | Exceptional $63,885 |
| Immigrants | Argentina | 95.5 /100 | #106 | Exceptional $63,885 |
| Pakistanis | 95.3 /100 | #107 | Exceptional $63,844 |
| Palestinians | 95.1 /100 | #108 | Exceptional $63,800 |
| Europeans | 95.0 /100 | #109 | Exceptional $63,779 |
| Immigrants | Zimbabwe | 94.3 /100 | #110 | Exceptional $63,643 |
| Immigrants | Spain | 93.7 /100 | #111 | Exceptional $63,540 |
| Syrians | 93.4 /100 | #112 | Exceptional $63,494 |
| Immigrants | Serbia | 92.7 /100 | #113 | Exceptional $63,387 |
| Immigrants | Saudi Arabia | 92.4 /100 | #114 | Exceptional $63,355 |
| Croatians | 91.4 /100 | #115 | Exceptional $63,225 |
| Guamanians/Chamorros | 91.1 /100 | #116 | Exceptional $63,187 |
| Immigrants | Croatia | 90.9 /100 | #117 | Exceptional $63,168 |
| Danes | 90.5 /100 | #118 | Exceptional $63,117 |
| Immigrants | Jordan | 89.8 /100 | #119 | Excellent $63,041 |
Demographics Similar to Immigrants from Eastern Asia by Householder Income Over 65 years
In terms of householder income over 65 years, the demographic groups most similar to Immigrants from Eastern Asia are Immigrants from Israel ($69,857, a difference of 0.020%), Immigrants from Japan ($69,774, a difference of 0.14%), Immigrants from Sweden ($69,722, a difference of 0.22%), Immigrants from Belgium ($69,703, a difference of 0.24%), and Immigrants from South Central Asia ($70,103, a difference of 0.33%).
| Demographics | Rating | Rank | Householder Income Over 65 years |
| Burmese | 100.0 /100 | #14 | Exceptional $71,139 |
| Native Hawaiians | 100.0 /100 | #15 | Exceptional $71,021 |
| Okinawans | 100.0 /100 | #16 | Exceptional $70,846 |
| Immigrants | Korea | 100.0 /100 | #17 | Exceptional $70,696 |
| Eastern Europeans | 100.0 /100 | #18 | Exceptional $70,470 |
| Indians (Asian) | 100.0 /100 | #19 | Exceptional $70,238 |
| Immigrants | South Central Asia | 100.0 /100 | #20 | Exceptional $70,103 |
| Immigrants | Eastern Asia | 100.0 /100 | #21 | Exceptional $69,872 |
| Immigrants | Israel | 100.0 /100 | #22 | Exceptional $69,857 |
| Immigrants | Japan | 100.0 /100 | #23 | Exceptional $69,774 |
| Immigrants | Sweden | 100.0 /100 | #24 | Exceptional $69,722 |
| Immigrants | Belgium | 100.0 /100 | #25 | Exceptional $69,703 |
| Immigrants | Sri Lanka | 100.0 /100 | #26 | Exceptional $69,426 |
| Immigrants | Switzerland | 100.0 /100 | #27 | Exceptional $69,343 |
| Immigrants | China | 100.0 /100 | #28 | Exceptional $69,174 |