Immigrants from Western Europe vs Immigrants from India Householder Income Over 65 years
COMPARE
Immigrants from Western Europe
Immigrants from India
Householder Income Over 65 years
Householder Income Over 65 years Comparison
Immigrants from Western Europe
Immigrants from India
$64,933
HOUSEHOLDER INCOME OVER 65 YEARS
98.5/ 100
METRIC RATING
78th/ 347
METRIC RANK
$72,804
HOUSEHOLDER INCOME OVER 65 YEARS
100.0/ 100
METRIC RATING
9th/ 347
METRIC RANK
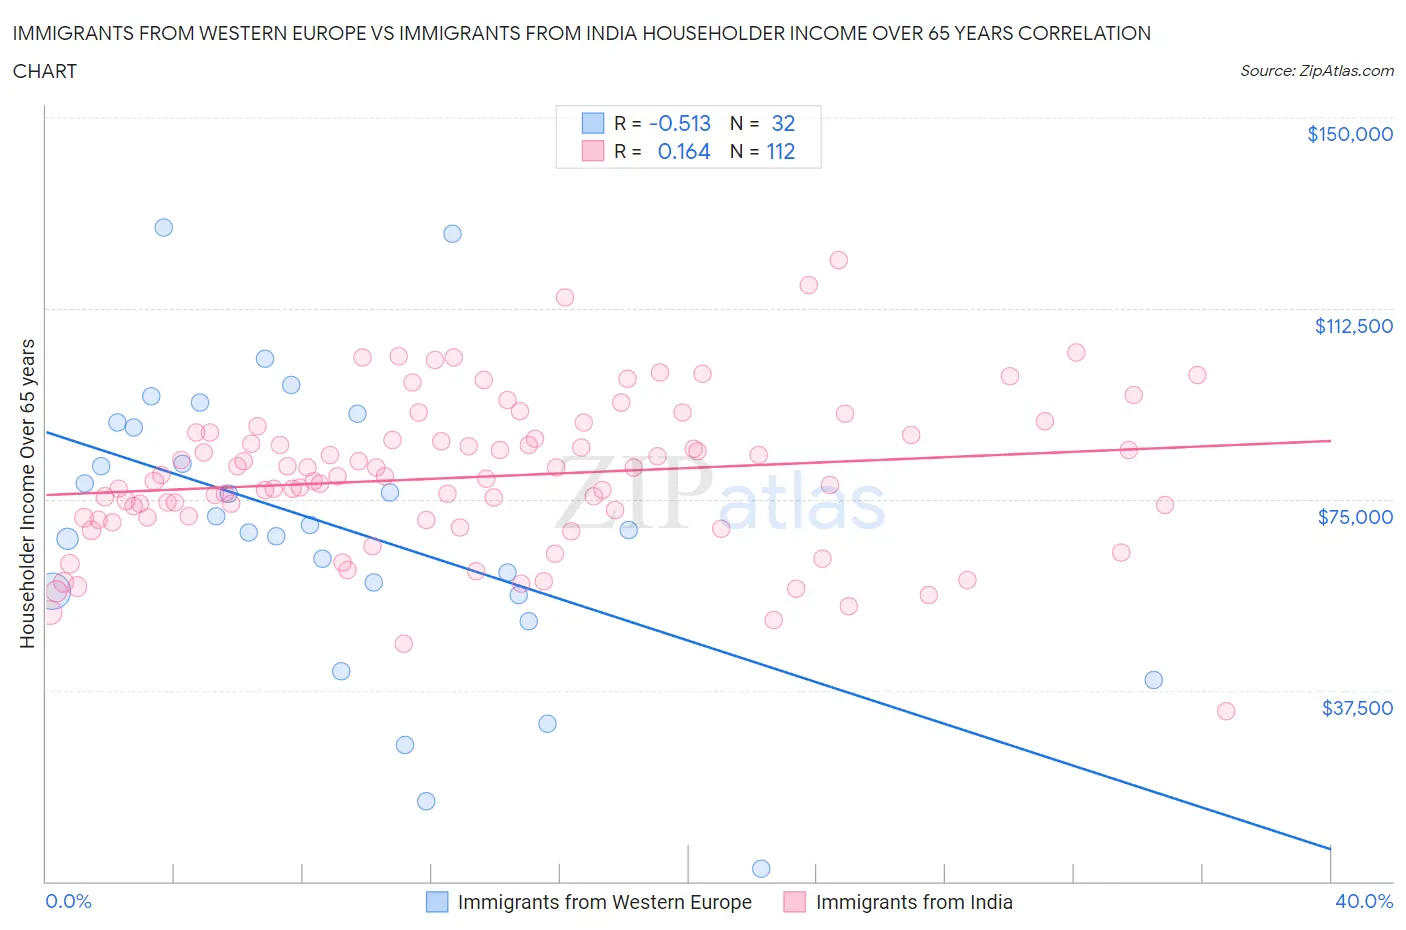
Immigrants from Western Europe vs Immigrants from India Householder Income Over 65 years Correlation Chart
The statistical analysis conducted on geographies consisting of 491,899,901 people shows a substantial negative correlation between the proportion of Immigrants from Western Europe and household income with householder over the age of 65 in the United States with a correlation coefficient (R) of -0.513 and weighted average of $64,933. Similarly, the statistical analysis conducted on geographies consisting of 432,463,371 people shows a poor positive correlation between the proportion of Immigrants from India and household income with householder over the age of 65 in the United States with a correlation coefficient (R) of 0.164 and weighted average of $72,804, a difference of 12.1%.
Householder Income Over 65 years Correlation Summary
| Measurement | Immigrants from Western Europe | Immigrants from India |
| Minimum | $2,499 | $33,500 |
| Maximum | $128,362 | $122,031 |
| Range | $125,863 | $88,531 |
| Mean | $69,616 | $79,433 |
| Median | $69,444 | $79,314 |
| Interquartile 25% (IQ1) | $56,605 | $71,130 |
| Interquartile 75% (IQ3) | $89,563 | $87,272 |
| Interquartile Range (IQR) | $32,958 | $16,142 |
| Standard Deviation (Sample) | $28,415 | $14,945 |
| Standard Deviation (Population) | $27,967 | $14,878 |
Similar Demographics by Householder Income Over 65 years
Demographics Similar to Immigrants from Western Europe by Householder Income Over 65 years
In terms of householder income over 65 years, the demographic groups most similar to Immigrants from Western Europe are Hawaiian ($64,920, a difference of 0.020%), Immigrants from Canada ($64,952, a difference of 0.030%), Ethiopian ($64,989, a difference of 0.090%), Immigrants from North America ($64,856, a difference of 0.12%), and Sierra Leonean ($65,038, a difference of 0.16%).
| Demographics | Rating | Rank | Householder Income Over 65 years |
| Greeks | 98.9 /100 | #71 | Exceptional $65,306 |
| Argentineans | 98.9 /100 | #72 | Exceptional $65,246 |
| Immigrants | Ethiopia | 98.9 /100 | #73 | Exceptional $65,238 |
| Lithuanians | 98.8 /100 | #74 | Exceptional $65,209 |
| Sierra Leoneans | 98.6 /100 | #75 | Exceptional $65,038 |
| Ethiopians | 98.5 /100 | #76 | Exceptional $64,989 |
| Immigrants | Canada | 98.5 /100 | #77 | Exceptional $64,952 |
| Immigrants | Western Europe | 98.5 /100 | #78 | Exceptional $64,933 |
| Hawaiians | 98.4 /100 | #79 | Exceptional $64,920 |
| Immigrants | North America | 98.3 /100 | #80 | Exceptional $64,856 |
| Immigrants | Europe | 98.3 /100 | #81 | Exceptional $64,828 |
| Immigrants | Fiji | 98.2 /100 | #82 | Exceptional $64,795 |
| Northern Europeans | 97.9 /100 | #83 | Exceptional $64,658 |
| Immigrants | Greece | 97.9 /100 | #84 | Exceptional $64,636 |
| Immigrants | Lebanon | 97.6 /100 | #85 | Exceptional $64,521 |
Demographics Similar to Immigrants from India by Householder Income Over 65 years
In terms of householder income over 65 years, the demographic groups most similar to Immigrants from India are Immigrants from Singapore ($72,963, a difference of 0.22%), Bhutanese ($72,288, a difference of 0.71%), Immigrants from Bolivia ($73,434, a difference of 0.87%), Thai ($72,099, a difference of 0.98%), and Cypriot ($71,714, a difference of 1.5%).
| Demographics | Rating | Rank | Householder Income Over 65 years |
| Iranians | 100.0 /100 | #2 | Exceptional $77,429 |
| Immigrants | Taiwan | 100.0 /100 | #3 | Exceptional $77,051 |
| Filipinos | 100.0 /100 | #4 | Exceptional $76,686 |
| Immigrants | Iran | 100.0 /100 | #5 | Exceptional $75,081 |
| Bolivians | 100.0 /100 | #6 | Exceptional $74,245 |
| Immigrants | Bolivia | 100.0 /100 | #7 | Exceptional $73,434 |
| Immigrants | Singapore | 100.0 /100 | #8 | Exceptional $72,963 |
| Immigrants | India | 100.0 /100 | #9 | Exceptional $72,804 |
| Bhutanese | 100.0 /100 | #10 | Exceptional $72,288 |
| Thais | 100.0 /100 | #11 | Exceptional $72,099 |
| Cypriots | 100.0 /100 | #12 | Exceptional $71,714 |
| Immigrants | Hong Kong | 100.0 /100 | #13 | Exceptional $71,567 |
| Burmese | 100.0 /100 | #14 | Exceptional $71,139 |
| Native Hawaiians | 100.0 /100 | #15 | Exceptional $71,021 |
| Okinawans | 100.0 /100 | #16 | Exceptional $70,846 |