Lebanese vs Immigrants from Bosnia and Herzegovina Householder Income Over 65 years
COMPARE
Lebanese
Immigrants from Bosnia and Herzegovina
Householder Income Over 65 years
Householder Income Over 65 years Comparison
Lebanese
Immigrants from Bosnia and Herzegovina
$62,287
HOUSEHOLDER INCOME OVER 65 YEARS
79.9/ 100
METRIC RATING
139th/ 347
METRIC RANK
$55,986
HOUSEHOLDER INCOME OVER 65 YEARS
0.5/ 100
METRIC RATING
250th/ 347
METRIC RANK
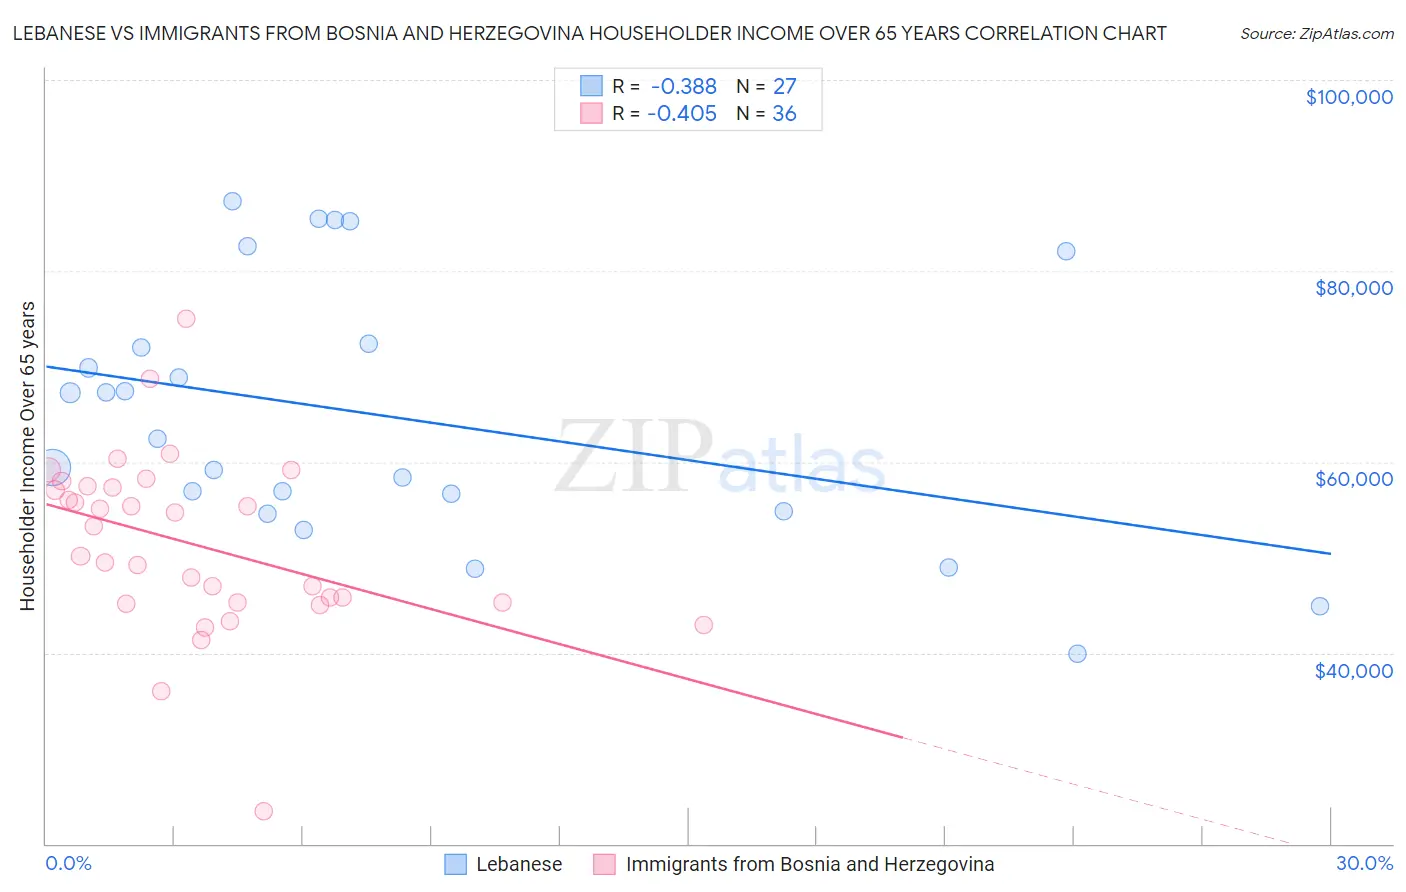
Lebanese vs Immigrants from Bosnia and Herzegovina Householder Income Over 65 years Correlation Chart
The statistical analysis conducted on geographies consisting of 400,240,263 people shows a mild negative correlation between the proportion of Lebanese and household income with householder over the age of 65 in the United States with a correlation coefficient (R) of -0.388 and weighted average of $62,287. Similarly, the statistical analysis conducted on geographies consisting of 156,709,633 people shows a moderate negative correlation between the proportion of Immigrants from Bosnia and Herzegovina and household income with householder over the age of 65 in the United States with a correlation coefficient (R) of -0.405 and weighted average of $55,986, a difference of 11.3%.
Householder Income Over 65 years Correlation Summary
| Measurement | Lebanese | Immigrants from Bosnia and Herzegovina |
| Minimum | $39,905 | $23,391 |
| Maximum | $87,260 | $74,953 |
| Range | $47,355 | $51,562 |
| Mean | $64,724 | $51,359 |
| Median | $62,393 | $51,669 |
| Interquartile 25% (IQ1) | $54,830 | $45,302 |
| Interquartile 75% (IQ3) | $72,386 | $57,366 |
| Interquartile Range (IQR) | $17,556 | $12,064 |
| Standard Deviation (Sample) | $13,483 | $9,347 |
| Standard Deviation (Population) | $13,231 | $9,217 |
Similar Demographics by Householder Income Over 65 years
Demographics Similar to Lebanese by Householder Income Over 65 years
In terms of householder income over 65 years, the demographic groups most similar to Lebanese are Immigrants from Kazakhstan ($62,292, a difference of 0.010%), Immigrants from Syria ($62,303, a difference of 0.030%), Arab ($62,266, a difference of 0.030%), Alaskan Athabascan ($62,330, a difference of 0.070%), and Canadian ($62,230, a difference of 0.090%).
| Demographics | Rating | Rank | Householder Income Over 65 years |
| Immigrants | Germany | 83.9 /100 | #132 | Excellent $62,544 |
| Immigrants | Northern Africa | 83.6 /100 | #133 | Excellent $62,522 |
| Immigrants | Brazil | 81.2 /100 | #134 | Excellent $62,364 |
| Immigrants | Chile | 81.0 /100 | #135 | Excellent $62,354 |
| Alaskan Athabascans | 80.6 /100 | #136 | Excellent $62,330 |
| Immigrants | Syria | 80.2 /100 | #137 | Excellent $62,303 |
| Immigrants | Kazakhstan | 80.0 /100 | #138 | Excellent $62,292 |
| Lebanese | 79.9 /100 | #139 | Good $62,287 |
| Arabs | 79.6 /100 | #140 | Good $62,266 |
| Canadians | 79.0 /100 | #141 | Good $62,230 |
| South American Indians | 78.7 /100 | #142 | Good $62,215 |
| Immigrants | Belarus | 77.8 /100 | #143 | Good $62,162 |
| Immigrants | Peru | 74.4 /100 | #144 | Good $61,988 |
| Immigrants | Uganda | 74.2 /100 | #145 | Good $61,976 |
| Immigrants | Southern Europe | 72.7 /100 | #146 | Good $61,902 |
Demographics Similar to Immigrants from Bosnia and Herzegovina by Householder Income Over 65 years
In terms of householder income over 65 years, the demographic groups most similar to Immigrants from Bosnia and Herzegovina are Immigrants from Portugal ($55,924, a difference of 0.11%), Mexican American Indian ($56,089, a difference of 0.19%), Vietnamese ($56,143, a difference of 0.28%), Yakama ($56,234, a difference of 0.44%), and Osage ($55,677, a difference of 0.55%).
| Demographics | Rating | Rank | Householder Income Over 65 years |
| Guyanese | 0.8 /100 | #243 | Tragic $56,351 |
| Hmong | 0.8 /100 | #244 | Tragic $56,339 |
| Immigrants | Uzbekistan | 0.8 /100 | #245 | Tragic $56,331 |
| Central Americans | 0.8 /100 | #246 | Tragic $56,321 |
| Yakama | 0.7 /100 | #247 | Tragic $56,234 |
| Vietnamese | 0.6 /100 | #248 | Tragic $56,143 |
| Mexican American Indians | 0.6 /100 | #249 | Tragic $56,089 |
| Immigrants | Bosnia and Herzegovina | 0.5 /100 | #250 | Tragic $55,986 |
| Immigrants | Portugal | 0.5 /100 | #251 | Tragic $55,924 |
| Osage | 0.4 /100 | #252 | Tragic $55,677 |
| Immigrants | Trinidad and Tobago | 0.4 /100 | #253 | Tragic $55,598 |
| Americans | 0.3 /100 | #254 | Tragic $55,527 |
| Immigrants | Bangladesh | 0.3 /100 | #255 | Tragic $55,394 |
| German Russians | 0.3 /100 | #256 | Tragic $55,356 |
| Trinidadians and Tobagonians | 0.3 /100 | #257 | Tragic $55,327 |