Swiss vs Immigrants from Uruguay Median Family Income
COMPARE
Swiss
Immigrants from Uruguay
Median Family Income
Median Family Income Comparison
Swiss
Immigrants from Uruguay
$104,396
MEDIAN FAMILY INCOME
70.7/ 100
METRIC RATING
159th/ 347
METRIC RANK
$98,205
MEDIAN FAMILY INCOME
9.2/ 100
METRIC RATING
208th/ 347
METRIC RANK
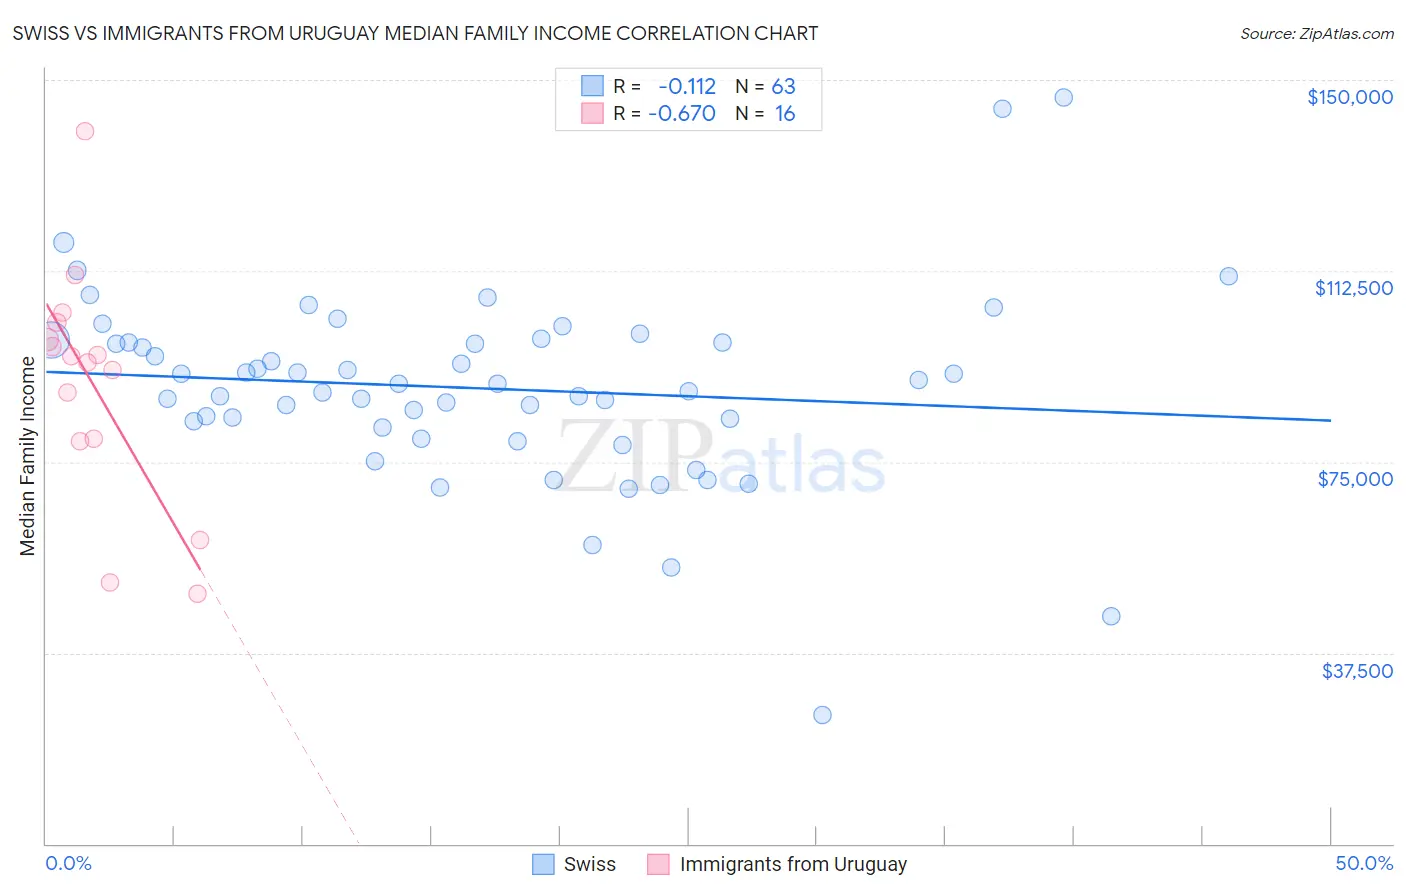
Swiss vs Immigrants from Uruguay Median Family Income Correlation Chart
The statistical analysis conducted on geographies consisting of 464,558,670 people shows a poor negative correlation between the proportion of Swiss and median family income in the United States with a correlation coefficient (R) of -0.112 and weighted average of $104,396. Similarly, the statistical analysis conducted on geographies consisting of 133,244,863 people shows a significant negative correlation between the proportion of Immigrants from Uruguay and median family income in the United States with a correlation coefficient (R) of -0.670 and weighted average of $98,205, a difference of 6.3%.
Median Family Income Correlation Summary
| Measurement | Swiss | Immigrants from Uruguay |
| Minimum | $25,401 | $49,007 |
| Maximum | $146,603 | $139,969 |
| Range | $121,202 | $90,962 |
| Mean | $89,459 | $90,062 |
| Median | $90,414 | $95,116 |
| Interquartile 25% (IQ1) | $81,791 | $79,263 |
| Interquartile 75% (IQ3) | $98,522 | $100,653 |
| Interquartile Range (IQR) | $16,731 | $21,390 |
| Standard Deviation (Sample) | $18,875 | $22,948 |
| Standard Deviation (Population) | $18,724 | $22,219 |
Similar Demographics by Median Family Income
Demographics Similar to Swiss by Median Family Income
In terms of median family income, the demographic groups most similar to Swiss are Scandinavian ($104,410, a difference of 0.010%), Moroccan ($104,488, a difference of 0.090%), Scottish ($104,288, a difference of 0.10%), Icelander ($104,282, a difference of 0.11%), and Basque ($104,760, a difference of 0.35%).
| Demographics | Rating | Rank | Median Family Income |
| Immigrants | Albania | 79.1 /100 | #152 | Good $105,285 |
| Slavs | 77.9 /100 | #153 | Good $105,144 |
| Immigrants | Nepal | 76.3 /100 | #154 | Good $104,966 |
| Native Hawaiians | 75.8 /100 | #155 | Good $104,910 |
| Basques | 74.4 /100 | #156 | Good $104,760 |
| Moroccans | 71.6 /100 | #157 | Good $104,488 |
| Scandinavians | 70.8 /100 | #158 | Good $104,410 |
| Swiss | 70.7 /100 | #159 | Good $104,396 |
| Scottish | 69.5 /100 | #160 | Good $104,288 |
| Icelanders | 69.4 /100 | #161 | Good $104,282 |
| Immigrants | Sierra Leone | 66.2 /100 | #162 | Good $103,990 |
| Costa Ricans | 66.2 /100 | #163 | Good $103,989 |
| Sierra Leoneans | 64.7 /100 | #164 | Good $103,859 |
| Slovaks | 63.1 /100 | #165 | Good $103,729 |
| English | 62.6 /100 | #166 | Good $103,684 |
Demographics Similar to Immigrants from Uruguay by Median Family Income
In terms of median family income, the demographic groups most similar to Immigrants from Uruguay are Immigrants from Colombia ($98,067, a difference of 0.14%), Puget Sound Salish ($97,958, a difference of 0.25%), Immigrants from Sudan ($97,737, a difference of 0.48%), Aleut ($98,702, a difference of 0.51%), and Panamanian ($97,683, a difference of 0.53%).
| Demographics | Rating | Rank | Median Family Income |
| Immigrants | Thailand | 19.0 /100 | #201 | Poor $99,840 |
| Whites/Caucasians | 18.7 /100 | #202 | Poor $99,800 |
| Scotch-Irish | 17.1 /100 | #203 | Poor $99,591 |
| Ghanaians | 12.6 /100 | #204 | Poor $98,877 |
| Hawaiians | 12.5 /100 | #205 | Poor $98,869 |
| Immigrants | Iraq | 12.1 /100 | #206 | Poor $98,786 |
| Aleuts | 11.6 /100 | #207 | Poor $98,702 |
| Immigrants | Uruguay | 9.2 /100 | #208 | Tragic $98,205 |
| Immigrants | Colombia | 8.7 /100 | #209 | Tragic $98,067 |
| Puget Sound Salish | 8.2 /100 | #210 | Tragic $97,958 |
| Immigrants | Sudan | 7.4 /100 | #211 | Tragic $97,737 |
| Panamanians | 7.2 /100 | #212 | Tragic $97,683 |
| Immigrants | Armenia | 7.0 /100 | #213 | Tragic $97,605 |
| Bermudans | 6.9 /100 | #214 | Tragic $97,577 |
| Nigerians | 6.7 /100 | #215 | Tragic $97,522 |