Immigrants from Romania vs German Median Family Income
COMPARE
Immigrants from Romania
German
Median Family Income
Median Family Income Comparison
Immigrants from Romania
Germans
$113,434
MEDIAN FAMILY INCOME
99.6/ 100
METRIC RATING
70th/ 347
METRIC RANK
$102,254
MEDIAN FAMILY INCOME
44.6/ 100
METRIC RATING
177th/ 347
METRIC RANK
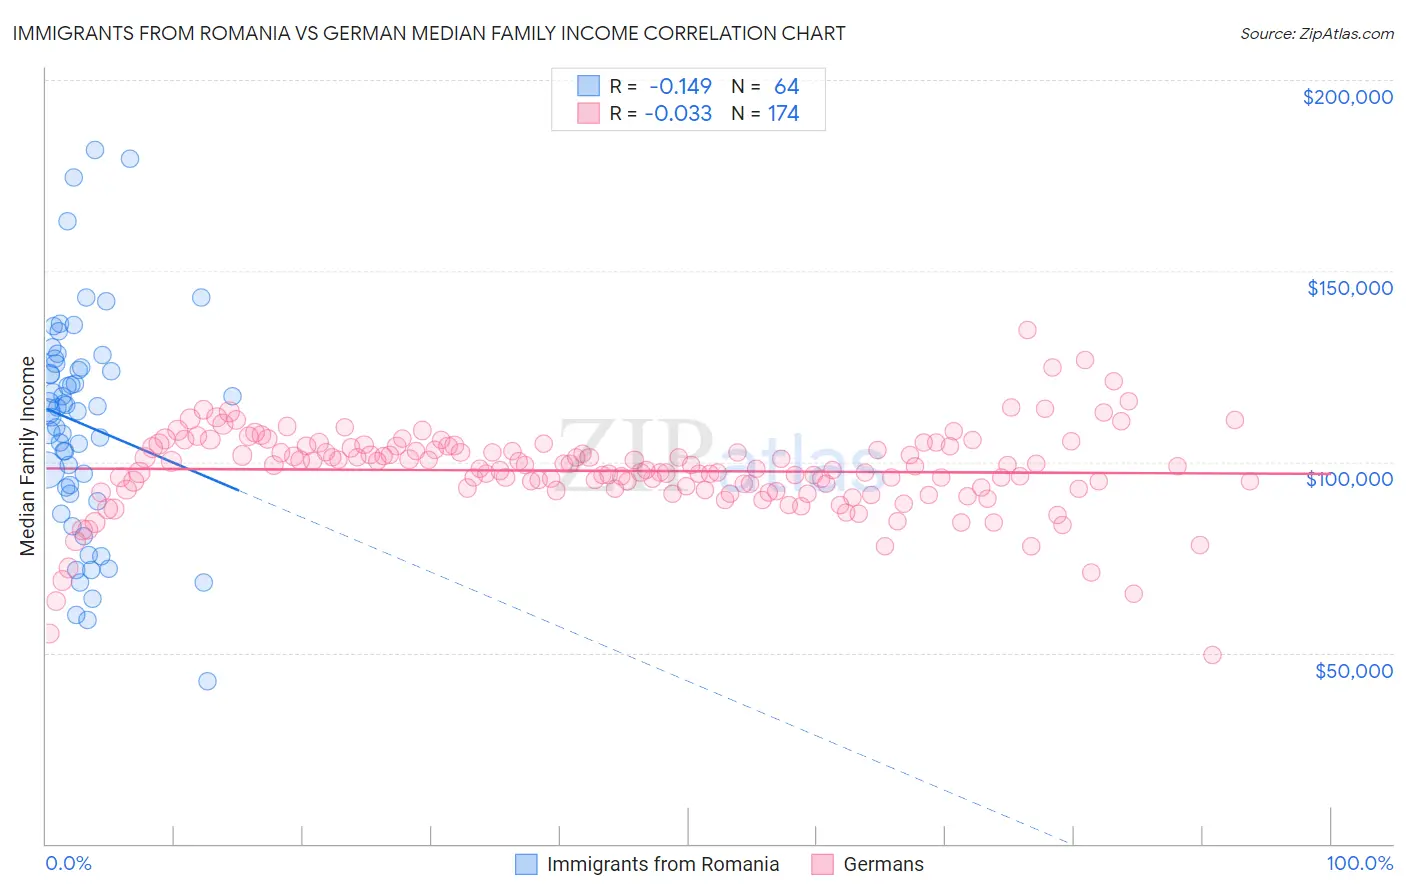
Immigrants from Romania vs German Median Family Income Correlation Chart
The statistical analysis conducted on geographies consisting of 256,919,145 people shows a poor negative correlation between the proportion of Immigrants from Romania and median family income in the United States with a correlation coefficient (R) of -0.149 and weighted average of $113,434. Similarly, the statistical analysis conducted on geographies consisting of 579,235,453 people shows no correlation between the proportion of Germans and median family income in the United States with a correlation coefficient (R) of -0.033 and weighted average of $102,254, a difference of 10.9%.
Median Family Income Correlation Summary
| Measurement | Immigrants from Romania | German |
| Minimum | $42,500 | $49,444 |
| Maximum | $181,711 | $134,628 |
| Range | $139,211 | $85,184 |
| Mean | $109,959 | $97,641 |
| Median | $113,781 | $98,482 |
| Interquartile 25% (IQ1) | $92,391 | $92,833 |
| Interquartile 75% (IQ3) | $125,210 | $104,084 |
| Interquartile Range (IQR) | $32,820 | $11,251 |
| Standard Deviation (Sample) | $28,709 | $11,245 |
| Standard Deviation (Population) | $28,484 | $11,212 |
Similar Demographics by Median Family Income
Demographics Similar to Immigrants from Romania by Median Family Income
In terms of median family income, the demographic groups most similar to Immigrants from Romania are Immigrants from Bulgaria ($113,461, a difference of 0.020%), Immigrants from Serbia ($113,463, a difference of 0.030%), South African ($113,229, a difference of 0.18%), Immigrants from Spain ($113,815, a difference of 0.34%), and Afghan ($112,971, a difference of 0.41%).
| Demographics | Rating | Rank | Median Family Income |
| Immigrants | Pakistan | 99.8 /100 | #63 | Exceptional $114,406 |
| Immigrants | Scotland | 99.7 /100 | #64 | Exceptional $114,392 |
| Egyptians | 99.7 /100 | #65 | Exceptional $114,119 |
| Paraguayans | 99.7 /100 | #66 | Exceptional $114,016 |
| Immigrants | Spain | 99.7 /100 | #67 | Exceptional $113,815 |
| Immigrants | Serbia | 99.6 /100 | #68 | Exceptional $113,463 |
| Immigrants | Bulgaria | 99.6 /100 | #69 | Exceptional $113,461 |
| Immigrants | Romania | 99.6 /100 | #70 | Exceptional $113,434 |
| South Africans | 99.5 /100 | #71 | Exceptional $113,229 |
| Afghans | 99.5 /100 | #72 | Exceptional $112,971 |
| Laotians | 99.5 /100 | #73 | Exceptional $112,859 |
| Immigrants | Italy | 99.4 /100 | #74 | Exceptional $112,848 |
| Immigrants | Western Europe | 99.4 /100 | #75 | Exceptional $112,688 |
| Argentineans | 99.4 /100 | #76 | Exceptional $112,665 |
| Immigrants | Eastern Europe | 99.4 /100 | #77 | Exceptional $112,527 |
Demographics Similar to Germans by Median Family Income
In terms of median family income, the demographic groups most similar to Germans are Welsh ($102,151, a difference of 0.10%), French ($102,368, a difference of 0.11%), Immigrants from Eastern Africa ($102,451, a difference of 0.19%), South American ($101,856, a difference of 0.39%), and Finnish ($102,676, a difference of 0.41%).
| Demographics | Rating | Rank | Median Family Income |
| Immigrants | Uzbekistan | 56.6 /100 | #170 | Average $103,197 |
| Alsatians | 54.3 /100 | #171 | Average $103,010 |
| Immigrants | Eritrea | 51.9 /100 | #172 | Average $102,823 |
| Belgians | 51.4 /100 | #173 | Average $102,788 |
| Finns | 50.0 /100 | #174 | Average $102,676 |
| Immigrants | Eastern Africa | 47.1 /100 | #175 | Average $102,451 |
| French | 46.1 /100 | #176 | Average $102,368 |
| Germans | 44.6 /100 | #177 | Average $102,254 |
| Welsh | 43.3 /100 | #178 | Average $102,151 |
| South Americans | 39.7 /100 | #179 | Fair $101,856 |
| French Canadians | 37.0 /100 | #180 | Fair $101,634 |
| Spaniards | 36.8 /100 | #181 | Fair $101,617 |
| Tsimshian | 35.9 /100 | #182 | Fair $101,543 |
| Kenyans | 34.5 /100 | #183 | Fair $101,417 |
| Immigrants | Costa Rica | 33.7 /100 | #184 | Fair $101,354 |