Immigrants from Sri Lanka vs Inupiat Householder Income Ages 45 - 64 years
COMPARE
Immigrants from Sri Lanka
Inupiat
Householder Income Ages 45 - 64 years
Householder Income Ages 45 - 64 years Comparison
Immigrants from Sri Lanka
Inupiat
$119,094
HOUSEHOLDER INCOME AGES 45 - 64 YEARS
100.0/ 100
METRIC RATING
21st/ 347
METRIC RANK
$91,355
HOUSEHOLDER INCOME AGES 45 - 64 YEARS
1.1/ 100
METRIC RATING
242nd/ 347
METRIC RANK
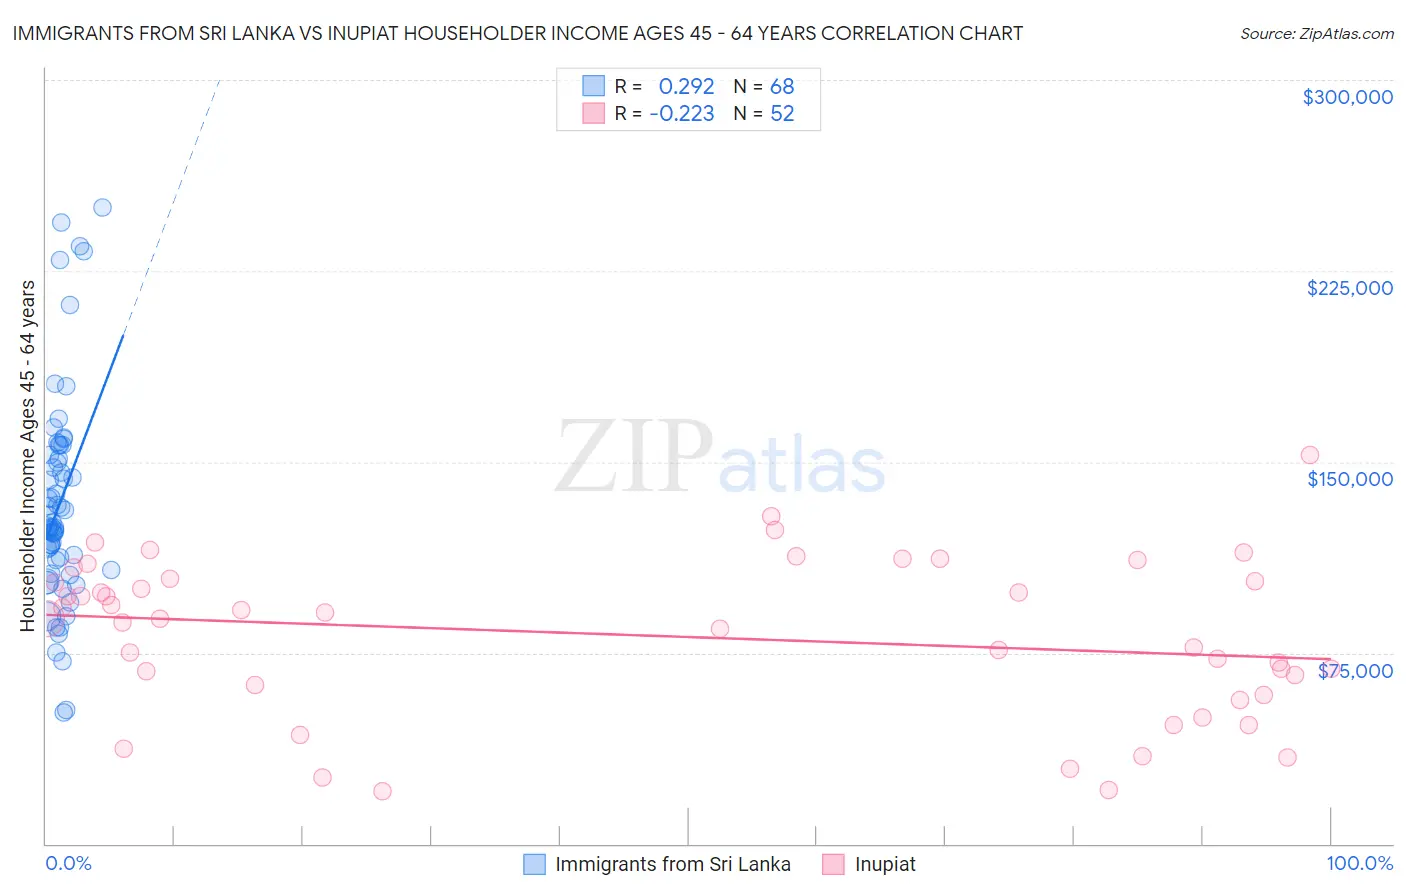
Immigrants from Sri Lanka vs Inupiat Householder Income Ages 45 - 64 years Correlation Chart
The statistical analysis conducted on geographies consisting of 149,646,211 people shows a weak positive correlation between the proportion of Immigrants from Sri Lanka and household income with householder between the ages 45 and 64 in the United States with a correlation coefficient (R) of 0.292 and weighted average of $119,094. Similarly, the statistical analysis conducted on geographies consisting of 96,273,732 people shows a weak negative correlation between the proportion of Inupiat and household income with householder between the ages 45 and 64 in the United States with a correlation coefficient (R) of -0.223 and weighted average of $91,355, a difference of 30.4%.
Householder Income Ages 45 - 64 years Correlation Summary
| Measurement | Immigrants from Sri Lanka | Inupiat |
| Minimum | $51,635 | $20,833 |
| Maximum | $250,001 | $152,917 |
| Range | $198,366 | $132,084 |
| Mean | $133,379 | $81,669 |
| Median | $124,481 | $88,444 |
| Interquartile 25% (IQ1) | $109,443 | $60,416 |
| Interquartile 75% (IQ3) | $152,000 | $103,725 |
| Interquartile Range (IQR) | $42,557 | $43,309 |
| Standard Deviation (Sample) | $41,610 | $30,923 |
| Standard Deviation (Population) | $41,303 | $30,625 |
Similar Demographics by Householder Income Ages 45 - 64 years
Demographics Similar to Immigrants from Sri Lanka by Householder Income Ages 45 - 64 years
In terms of householder income ages 45 - 64 years, the demographic groups most similar to Immigrants from Sri Lanka are Immigrants from Belgium ($118,932, a difference of 0.14%), Immigrants from Australia ($119,308, a difference of 0.18%), Bolivian ($118,871, a difference of 0.19%), Immigrants from Japan ($118,498, a difference of 0.50%), and Asian ($118,426, a difference of 0.56%).
| Demographics | Rating | Rank | Householder Income Ages 45 - 64 years |
| Indians (Asian) | 100.0 /100 | #14 | Exceptional $122,343 |
| Immigrants | Eastern Asia | 100.0 /100 | #15 | Exceptional $122,222 |
| Immigrants | China | 100.0 /100 | #16 | Exceptional $122,178 |
| Burmese | 100.0 /100 | #17 | Exceptional $121,444 |
| Immigrants | Korea | 100.0 /100 | #18 | Exceptional $121,243 |
| Eastern Europeans | 100.0 /100 | #19 | Exceptional $120,684 |
| Immigrants | Australia | 100.0 /100 | #20 | Exceptional $119,308 |
| Immigrants | Sri Lanka | 100.0 /100 | #21 | Exceptional $119,094 |
| Immigrants | Belgium | 100.0 /100 | #22 | Exceptional $118,932 |
| Bolivians | 100.0 /100 | #23 | Exceptional $118,871 |
| Immigrants | Japan | 100.0 /100 | #24 | Exceptional $118,498 |
| Asians | 100.0 /100 | #25 | Exceptional $118,426 |
| Immigrants | Sweden | 100.0 /100 | #26 | Exceptional $118,318 |
| Immigrants | Northern Europe | 100.0 /100 | #27 | Exceptional $117,930 |
| Turks | 100.0 /100 | #28 | Exceptional $117,814 |
Demographics Similar to Inupiat by Householder Income Ages 45 - 64 years
In terms of householder income ages 45 - 64 years, the demographic groups most similar to Inupiat are Trinidadian and Tobagonian ($91,357, a difference of 0.0%), Immigrants from Trinidad and Tobago ($91,347, a difference of 0.010%), Immigrants from Burma/Myanmar ($91,385, a difference of 0.030%), Immigrants from Middle Africa ($91,293, a difference of 0.070%), and Immigrants from Ecuador ($91,462, a difference of 0.12%).
| Demographics | Rating | Rank | Householder Income Ages 45 - 64 years |
| Nicaraguans | 2.0 /100 | #235 | Tragic $92,554 |
| Immigrants | Western Africa | 1.8 /100 | #236 | Tragic $92,384 |
| Immigrants | Bangladesh | 1.7 /100 | #237 | Tragic $92,208 |
| Pennsylvania Germans | 1.5 /100 | #238 | Tragic $91,956 |
| Immigrants | Ecuador | 1.2 /100 | #239 | Tragic $91,462 |
| Immigrants | Burma/Myanmar | 1.1 /100 | #240 | Tragic $91,385 |
| Trinidadians and Tobagonians | 1.1 /100 | #241 | Tragic $91,357 |
| Inupiat | 1.1 /100 | #242 | Tragic $91,355 |
| Immigrants | Trinidad and Tobago | 1.1 /100 | #243 | Tragic $91,347 |
| Immigrants | Middle Africa | 1.1 /100 | #244 | Tragic $91,293 |
| Guyanese | 0.9 /100 | #245 | Tragic $90,966 |
| Central Americans | 0.9 /100 | #246 | Tragic $90,951 |
| Alaskan Athabascans | 0.9 /100 | #247 | Tragic $90,951 |
| Immigrants | Laos | 0.9 /100 | #248 | Tragic $90,909 |
| Mexican American Indians | 0.8 /100 | #249 | Tragic $90,811 |