Immigrants from Senegal vs Inupiat Householder Income Ages 45 - 64 years
COMPARE
Immigrants from Senegal
Inupiat
Householder Income Ages 45 - 64 years
Householder Income Ages 45 - 64 years Comparison
Immigrants from Senegal
Inupiat
$88,421
HOUSEHOLDER INCOME AGES 45 - 64 YEARS
0.3/ 100
METRIC RATING
263rd/ 347
METRIC RANK
$91,355
HOUSEHOLDER INCOME AGES 45 - 64 YEARS
1.1/ 100
METRIC RATING
242nd/ 347
METRIC RANK
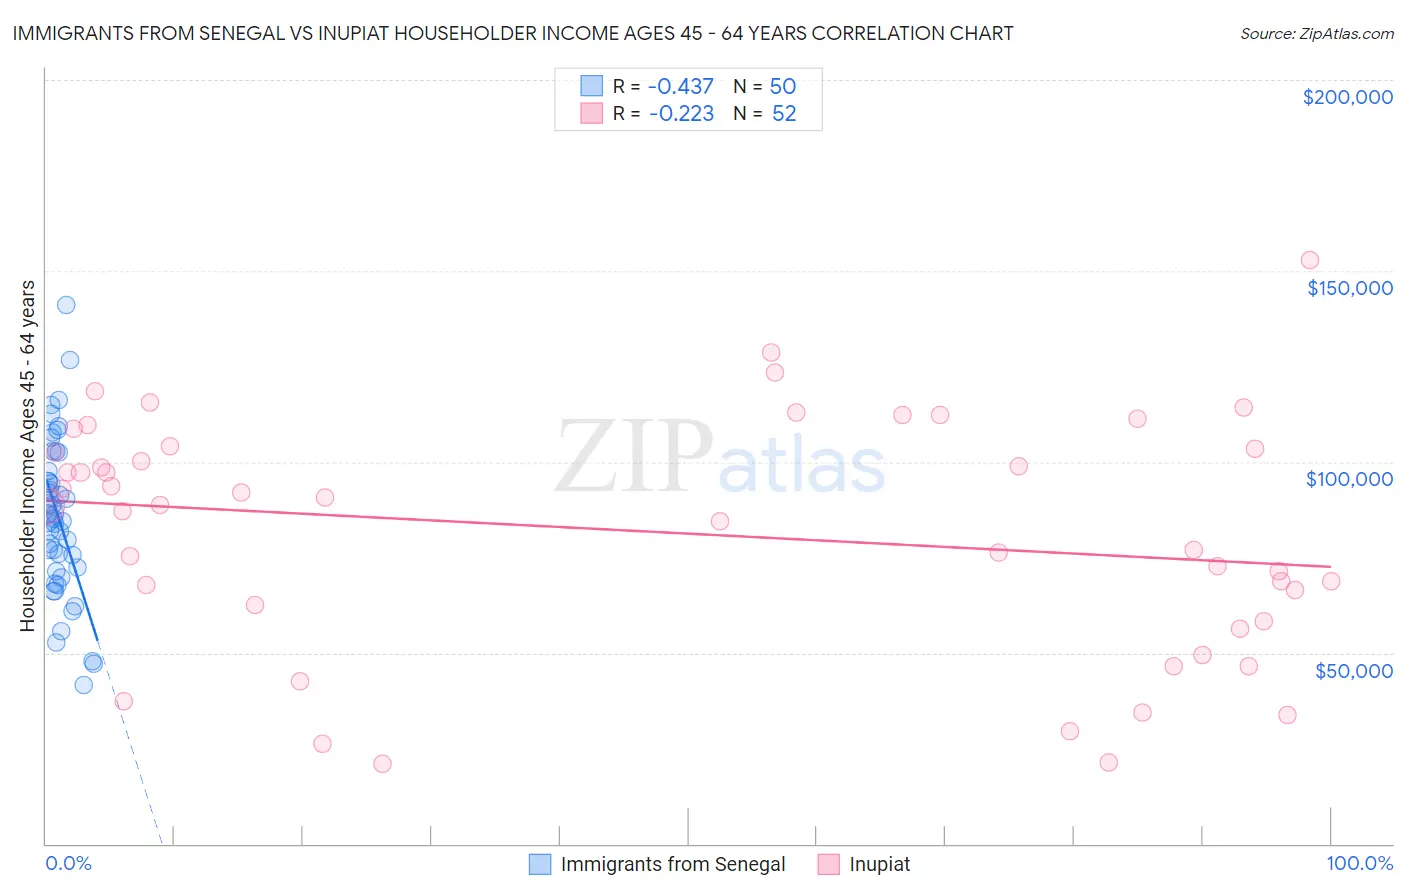
Immigrants from Senegal vs Inupiat Householder Income Ages 45 - 64 years Correlation Chart
The statistical analysis conducted on geographies consisting of 90,099,692 people shows a moderate negative correlation between the proportion of Immigrants from Senegal and household income with householder between the ages 45 and 64 in the United States with a correlation coefficient (R) of -0.437 and weighted average of $88,421. Similarly, the statistical analysis conducted on geographies consisting of 96,273,732 people shows a weak negative correlation between the proportion of Inupiat and household income with householder between the ages 45 and 64 in the United States with a correlation coefficient (R) of -0.223 and weighted average of $91,355, a difference of 3.3%.
Householder Income Ages 45 - 64 years Correlation Summary
| Measurement | Immigrants from Senegal | Inupiat |
| Minimum | $41,574 | $20,833 |
| Maximum | $140,938 | $152,917 |
| Range | $99,364 | $132,084 |
| Mean | $85,290 | $81,669 |
| Median | $85,076 | $88,444 |
| Interquartile 25% (IQ1) | $71,475 | $60,416 |
| Interquartile 75% (IQ3) | $97,575 | $103,725 |
| Interquartile Range (IQR) | $26,100 | $43,309 |
| Standard Deviation (Sample) | $20,782 | $30,923 |
| Standard Deviation (Population) | $20,574 | $30,625 |
Similar Demographics by Householder Income Ages 45 - 64 years
Demographics Similar to Immigrants from Senegal by Householder Income Ages 45 - 64 years
In terms of householder income ages 45 - 64 years, the demographic groups most similar to Immigrants from Senegal are Osage ($88,390, a difference of 0.040%), Jamaican ($88,327, a difference of 0.11%), Somali ($88,600, a difference of 0.20%), Immigrants from West Indies ($88,164, a difference of 0.29%), and Belizean ($88,684, a difference of 0.30%).
| Demographics | Rating | Rank | Householder Income Ages 45 - 64 years |
| French American Indians | 0.5 /100 | #256 | Tragic $89,811 |
| German Russians | 0.4 /100 | #257 | Tragic $89,398 |
| Immigrants | Barbados | 0.4 /100 | #258 | Tragic $89,394 |
| Immigrants | Nicaragua | 0.4 /100 | #259 | Tragic $89,108 |
| Liberians | 0.3 /100 | #260 | Tragic $88,929 |
| Belizeans | 0.3 /100 | #261 | Tragic $88,684 |
| Somalis | 0.3 /100 | #262 | Tragic $88,600 |
| Immigrants | Senegal | 0.3 /100 | #263 | Tragic $88,421 |
| Osage | 0.3 /100 | #264 | Tragic $88,390 |
| Jamaicans | 0.2 /100 | #265 | Tragic $88,327 |
| Immigrants | West Indies | 0.2 /100 | #266 | Tragic $88,164 |
| Hmong | 0.2 /100 | #267 | Tragic $88,115 |
| Immigrants | Micronesia | 0.2 /100 | #268 | Tragic $87,864 |
| Spanish Americans | 0.2 /100 | #269 | Tragic $87,836 |
| Immigrants | Liberia | 0.2 /100 | #270 | Tragic $87,739 |
Demographics Similar to Inupiat by Householder Income Ages 45 - 64 years
In terms of householder income ages 45 - 64 years, the demographic groups most similar to Inupiat are Trinidadian and Tobagonian ($91,357, a difference of 0.0%), Immigrants from Trinidad and Tobago ($91,347, a difference of 0.010%), Immigrants from Burma/Myanmar ($91,385, a difference of 0.030%), Immigrants from Middle Africa ($91,293, a difference of 0.070%), and Immigrants from Ecuador ($91,462, a difference of 0.12%).
| Demographics | Rating | Rank | Householder Income Ages 45 - 64 years |
| Nicaraguans | 2.0 /100 | #235 | Tragic $92,554 |
| Immigrants | Western Africa | 1.8 /100 | #236 | Tragic $92,384 |
| Immigrants | Bangladesh | 1.7 /100 | #237 | Tragic $92,208 |
| Pennsylvania Germans | 1.5 /100 | #238 | Tragic $91,956 |
| Immigrants | Ecuador | 1.2 /100 | #239 | Tragic $91,462 |
| Immigrants | Burma/Myanmar | 1.1 /100 | #240 | Tragic $91,385 |
| Trinidadians and Tobagonians | 1.1 /100 | #241 | Tragic $91,357 |
| Inupiat | 1.1 /100 | #242 | Tragic $91,355 |
| Immigrants | Trinidad and Tobago | 1.1 /100 | #243 | Tragic $91,347 |
| Immigrants | Middle Africa | 1.1 /100 | #244 | Tragic $91,293 |
| Guyanese | 0.9 /100 | #245 | Tragic $90,966 |
| Central Americans | 0.9 /100 | #246 | Tragic $90,951 |
| Alaskan Athabascans | 0.9 /100 | #247 | Tragic $90,951 |
| Immigrants | Laos | 0.9 /100 | #248 | Tragic $90,909 |
| Mexican American Indians | 0.8 /100 | #249 | Tragic $90,811 |