Swedish vs Immigrants from Ireland Median Earnings
COMPARE
Swedish
Immigrants from Ireland
Median Earnings
Median Earnings Comparison
Swedes
Immigrants from Ireland
$47,851
MEDIAN EARNINGS
88.0/ 100
METRIC RATING
143rd/ 347
METRIC RANK
$56,854
MEDIAN EARNINGS
100.0/ 100
METRIC RATING
12th/ 347
METRIC RANK
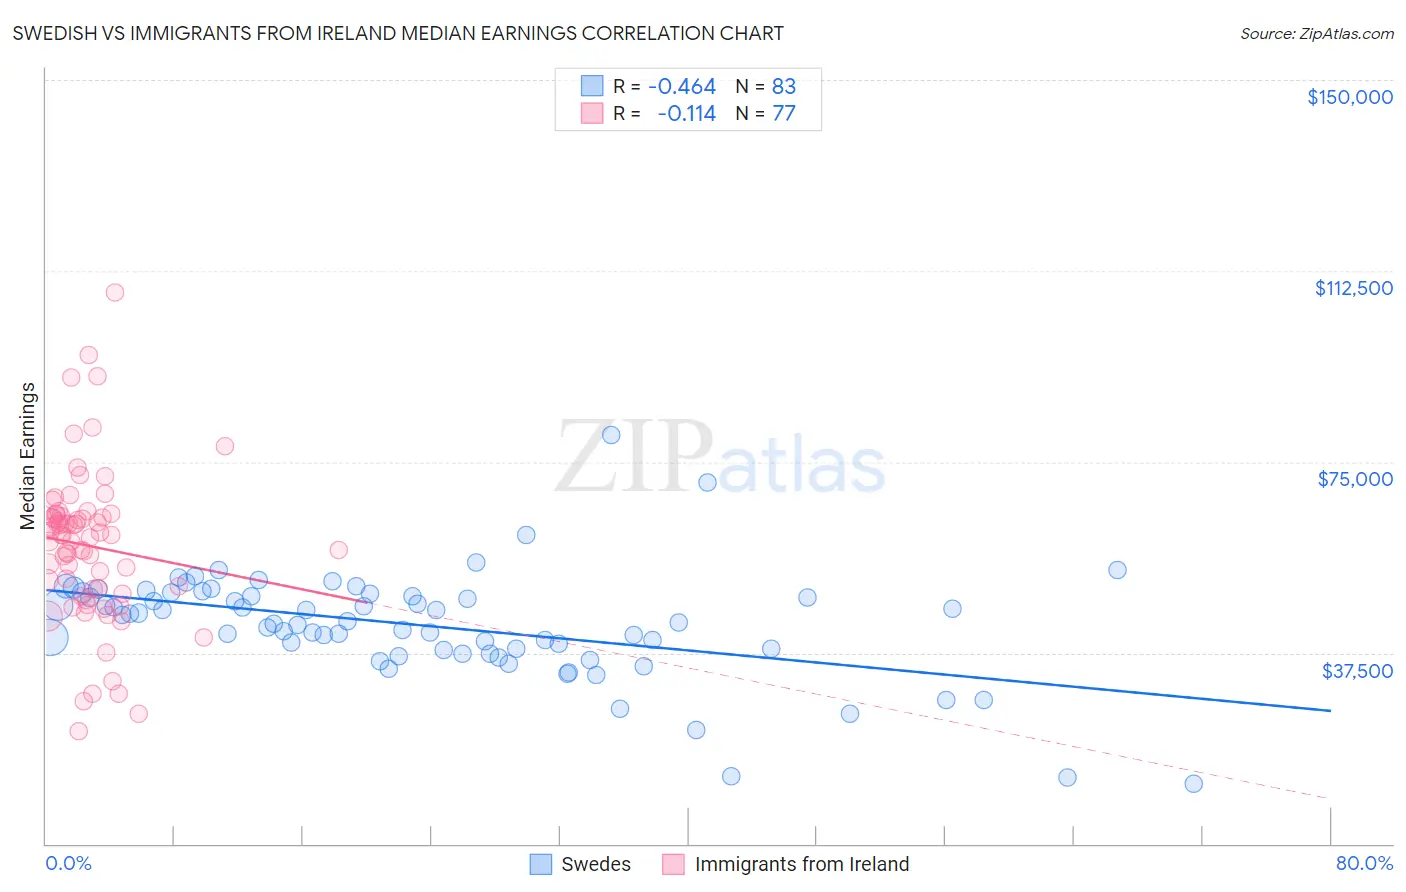
Swedish vs Immigrants from Ireland Median Earnings Correlation Chart
The statistical analysis conducted on geographies consisting of 538,996,314 people shows a moderate negative correlation between the proportion of Swedes and median earnings in the United States with a correlation coefficient (R) of -0.464 and weighted average of $47,851. Similarly, the statistical analysis conducted on geographies consisting of 240,768,964 people shows a poor negative correlation between the proportion of Immigrants from Ireland and median earnings in the United States with a correlation coefficient (R) of -0.114 and weighted average of $56,854, a difference of 18.8%.
Median Earnings Correlation Summary
| Measurement | Swedish | Immigrants from Ireland |
| Minimum | $11,875 | $22,198 |
| Maximum | $80,254 | $108,333 |
| Range | $68,379 | $86,135 |
| Mean | $42,935 | $58,485 |
| Median | $43,757 | $60,577 |
| Interquartile 25% (IQ1) | $37,994 | $49,600 |
| Interquartile 75% (IQ3) | $49,030 | $64,376 |
| Interquartile Range (IQR) | $11,035 | $14,776 |
| Standard Deviation (Sample) | $10,532 | $15,214 |
| Standard Deviation (Population) | $10,468 | $15,114 |
Similar Demographics by Median Earnings
Demographics Similar to Swedes by Median Earnings
In terms of median earnings, the demographic groups most similar to Swedes are Ugandan ($47,854, a difference of 0.010%), Immigrants from Sierra Leone ($47,875, a difference of 0.050%), Taiwanese ($47,902, a difference of 0.11%), Hungarian ($47,795, a difference of 0.12%), and European ($47,915, a difference of 0.13%).
| Demographics | Rating | Rank | Median Earnings |
| Slovenes | 90.0 /100 | #136 | Excellent $47,995 |
| Immigrants | Nepal | 89.0 /100 | #137 | Excellent $47,925 |
| Europeans | 88.9 /100 | #138 | Excellent $47,915 |
| Canadians | 88.8 /100 | #139 | Excellent $47,911 |
| Taiwanese | 88.7 /100 | #140 | Excellent $47,902 |
| Immigrants | Sierra Leone | 88.3 /100 | #141 | Excellent $47,875 |
| Ugandans | 88.0 /100 | #142 | Excellent $47,854 |
| Swedes | 88.0 /100 | #143 | Excellent $47,851 |
| Hungarians | 87.1 /100 | #144 | Excellent $47,795 |
| Immigrants | Saudi Arabia | 85.6 /100 | #145 | Excellent $47,704 |
| Immigrants | Chile | 85.5 /100 | #146 | Excellent $47,697 |
| Immigrants | South Eastern Asia | 85.0 /100 | #147 | Excellent $47,671 |
| Immigrants | Eritrea | 84.8 /100 | #148 | Excellent $47,657 |
| Luxembourgers | 84.5 /100 | #149 | Excellent $47,640 |
| Peruvians | 84.2 /100 | #150 | Excellent $47,628 |
Demographics Similar to Immigrants from Ireland by Median Earnings
In terms of median earnings, the demographic groups most similar to Immigrants from Ireland are Immigrants from Israel ($57,034, a difference of 0.32%), Immigrants from China ($56,638, a difference of 0.38%), Immigrants from South Central Asia ($57,114, a difference of 0.46%), Immigrants from Australia ($56,305, a difference of 0.97%), and Indian (Asian) ($56,253, a difference of 1.1%).
| Demographics | Rating | Rank | Median Earnings |
| Thais | 100.0 /100 | #5 | Exceptional $59,237 |
| Immigrants | Singapore | 100.0 /100 | #6 | Exceptional $59,038 |
| Iranians | 100.0 /100 | #7 | Exceptional $58,474 |
| Immigrants | Iran | 100.0 /100 | #8 | Exceptional $57,612 |
| Okinawans | 100.0 /100 | #9 | Exceptional $57,550 |
| Immigrants | South Central Asia | 100.0 /100 | #10 | Exceptional $57,114 |
| Immigrants | Israel | 100.0 /100 | #11 | Exceptional $57,034 |
| Immigrants | Ireland | 100.0 /100 | #12 | Exceptional $56,854 |
| Immigrants | China | 100.0 /100 | #13 | Exceptional $56,638 |
| Immigrants | Australia | 100.0 /100 | #14 | Exceptional $56,305 |
| Indians (Asian) | 100.0 /100 | #15 | Exceptional $56,253 |
| Immigrants | Eastern Asia | 100.0 /100 | #16 | Exceptional $56,183 |
| Eastern Europeans | 100.0 /100 | #17 | Exceptional $55,084 |
| Immigrants | Japan | 100.0 /100 | #18 | Exceptional $54,938 |
| Immigrants | Belgium | 100.0 /100 | #19 | Exceptional $54,679 |