Swedish vs Immigrants from Portugal Wage/Income Gap
COMPARE
Swedish
Immigrants from Portugal
Wage/Income Gap
Wage/Income Gap Comparison
Swedes
Immigrants from Portugal
29.4%
WAGE/INCOME GAP
0.0/ 100
METRIC RATING
334th/ 347
METRIC RANK
26.7%
WAGE/INCOME GAP
9.5/ 100
METRIC RATING
216th/ 347
METRIC RANK
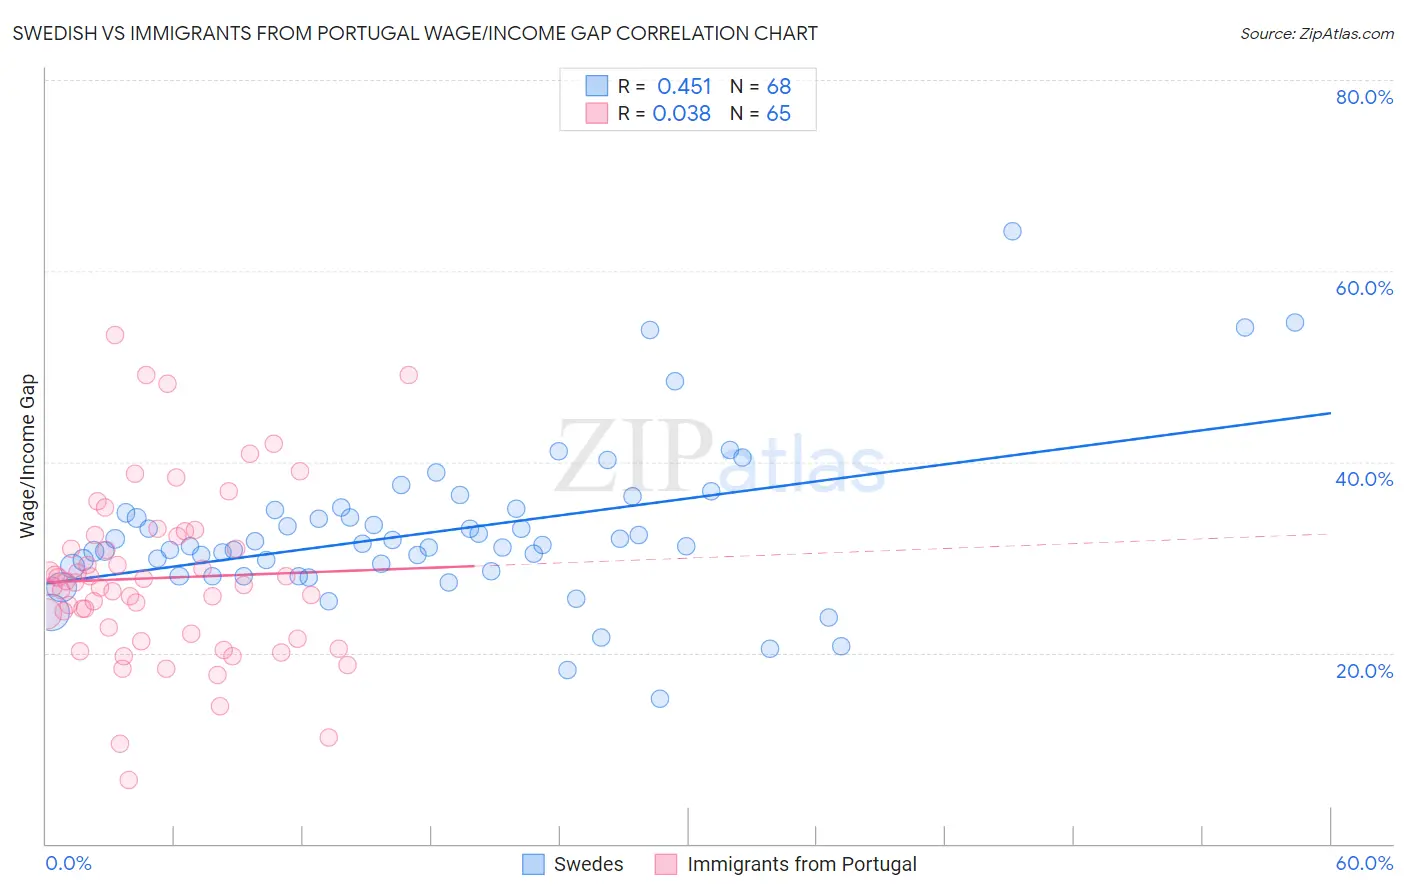
Swedish vs Immigrants from Portugal Wage/Income Gap Correlation Chart
The statistical analysis conducted on geographies consisting of 537,447,925 people shows a moderate positive correlation between the proportion of Swedes and wage/income gap percentage in the United States with a correlation coefficient (R) of 0.451 and weighted average of 29.4%. Similarly, the statistical analysis conducted on geographies consisting of 174,735,300 people shows no correlation between the proportion of Immigrants from Portugal and wage/income gap percentage in the United States with a correlation coefficient (R) of 0.038 and weighted average of 26.7%, a difference of 10.1%.
Wage/Income Gap Correlation Summary
| Measurement | Swedish | Immigrants from Portugal |
| Minimum | 15.2% | 6.7% |
| Maximum | 64.2% | 53.3% |
| Range | 49.0% | 46.6% |
| Mean | 32.7% | 27.8% |
| Median | 31.2% | 27.1% |
| Interquartile 25% (IQ1) | 28.8% | 21.7% |
| Interquartile 75% (IQ3) | 34.8% | 32.3% |
| Interquartile Range (IQR) | 6.1% | 10.6% |
| Standard Deviation (Sample) | 8.2% | 9.0% |
| Standard Deviation (Population) | 8.1% | 9.0% |
Similar Demographics by Wage/Income Gap
Demographics Similar to Swedes by Wage/Income Gap
In terms of wage/income gap, the demographic groups most similar to Swedes are Immigrants from Taiwan (29.5%, a difference of 0.13%), European (29.4%, a difference of 0.14%), English (29.5%, a difference of 0.14%), Immigrants from South Central Asia (29.3%, a difference of 0.34%), and Dutch (29.6%, a difference of 0.72%).
| Demographics | Rating | Rank | Wage/Income Gap |
| Immigrants | Iran | 0.0 /100 | #327 | Tragic 29.1% |
| Scandinavians | 0.0 /100 | #328 | Tragic 29.1% |
| Scottish | 0.0 /100 | #329 | Tragic 29.1% |
| Germans | 0.0 /100 | #330 | Tragic 29.2% |
| Czechs | 0.0 /100 | #331 | Tragic 29.2% |
| Immigrants | South Central Asia | 0.0 /100 | #332 | Tragic 29.3% |
| Europeans | 0.0 /100 | #333 | Tragic 29.4% |
| Swedes | 0.0 /100 | #334 | Tragic 29.4% |
| Immigrants | Taiwan | 0.0 /100 | #335 | Tragic 29.5% |
| English | 0.0 /100 | #336 | Tragic 29.5% |
| Dutch | 0.0 /100 | #337 | Tragic 29.6% |
| Filipinos | 0.0 /100 | #338 | Tragic 29.7% |
| Iranians | 0.0 /100 | #339 | Tragic 29.7% |
| Swiss | 0.0 /100 | #340 | Tragic 30.0% |
| Thais | 0.0 /100 | #341 | Tragic 30.5% |
Demographics Similar to Immigrants from Portugal by Wage/Income Gap
In terms of wage/income gap, the demographic groups most similar to Immigrants from Portugal are Yugoslavian (26.7%, a difference of 0.040%), Brazilian (26.7%, a difference of 0.050%), Immigrants from Saudi Arabia (26.7%, a difference of 0.080%), Immigrants from Poland (26.7%, a difference of 0.11%), and Immigrants from Latvia (26.7%, a difference of 0.12%).
| Demographics | Rating | Rank | Wage/Income Gap |
| Immigrants | Kuwait | 12.6 /100 | #209 | Poor 26.6% |
| Arabs | 12.3 /100 | #210 | Poor 26.6% |
| Mongolians | 11.4 /100 | #211 | Poor 26.6% |
| Iraqis | 11.2 /100 | #212 | Poor 26.6% |
| Immigrants | Iraq | 10.3 /100 | #213 | Poor 26.7% |
| Immigrants | China | 10.3 /100 | #214 | Poor 26.7% |
| Yugoslavians | 9.7 /100 | #215 | Tragic 26.7% |
| Immigrants | Portugal | 9.5 /100 | #216 | Tragic 26.7% |
| Brazilians | 9.2 /100 | #217 | Tragic 26.7% |
| Immigrants | Saudi Arabia | 9.1 /100 | #218 | Tragic 26.7% |
| Immigrants | Poland | 8.9 /100 | #219 | Tragic 26.7% |
| Immigrants | Latvia | 8.9 /100 | #220 | Tragic 26.7% |
| Immigrants | Spain | 8.5 /100 | #221 | Tragic 26.8% |
| Bolivians | 8.3 /100 | #222 | Tragic 26.8% |
| Jordanians | 8.0 /100 | #223 | Tragic 26.8% |