Sudanese vs Immigrants from Iraq Householder Income Ages 25 - 44 years
COMPARE
Sudanese
Immigrants from Iraq
Householder Income Ages 25 - 44 years
Householder Income Ages 25 - 44 years Comparison
Sudanese
Immigrants from Iraq
$84,401
HOUSEHOLDER INCOME AGES 25 - 44 YEARS
0.4/ 100
METRIC RATING
265th/ 347
METRIC RANK
$89,444
HOUSEHOLDER INCOME AGES 25 - 44 YEARS
5.5/ 100
METRIC RATING
226th/ 347
METRIC RANK
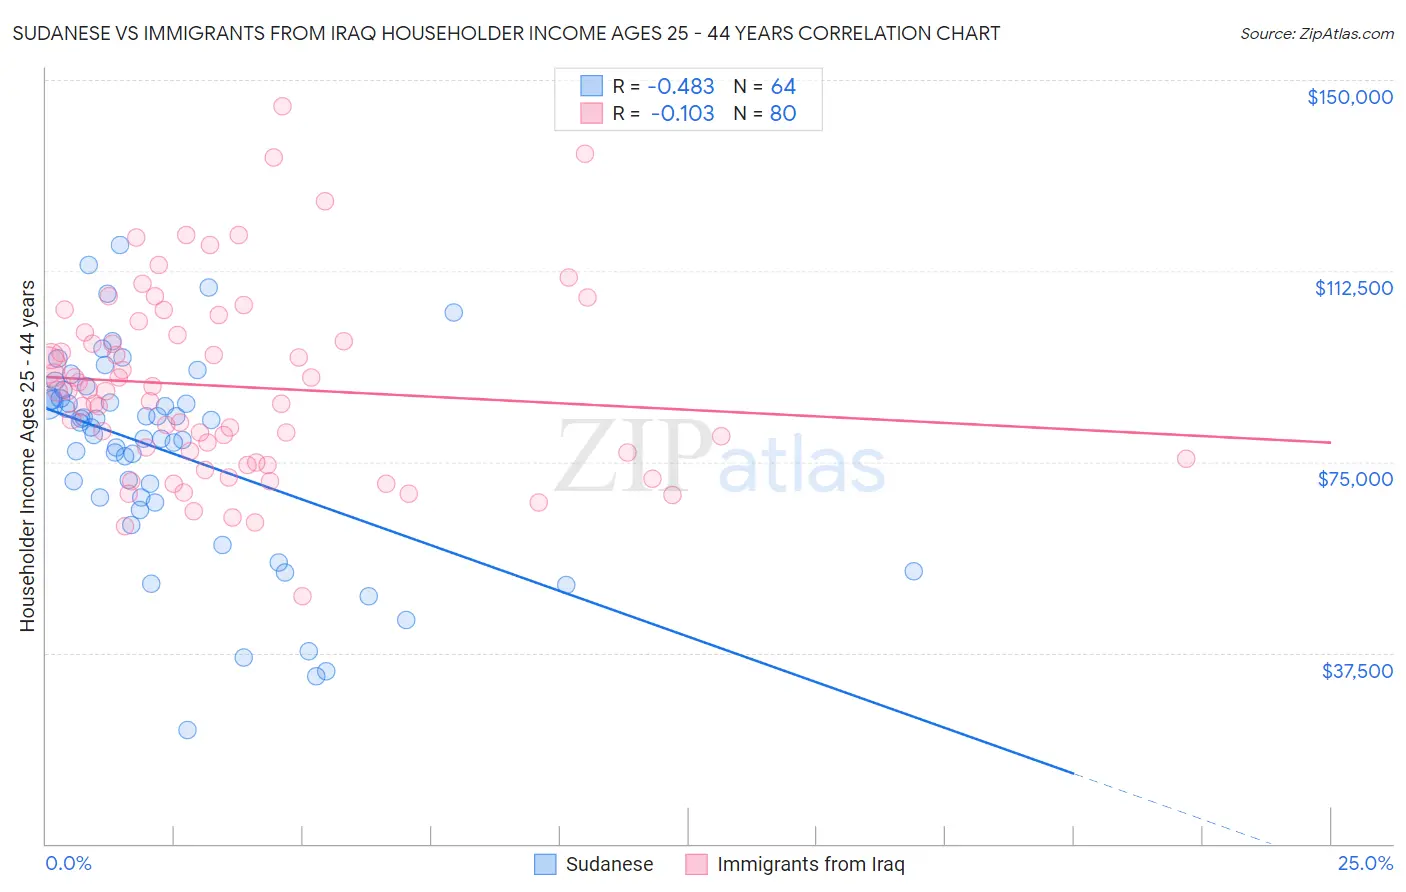
Sudanese vs Immigrants from Iraq Householder Income Ages 25 - 44 years Correlation Chart
The statistical analysis conducted on geographies consisting of 110,044,809 people shows a moderate negative correlation between the proportion of Sudanese and household income with householder between the ages 25 and 44 in the United States with a correlation coefficient (R) of -0.483 and weighted average of $84,401. Similarly, the statistical analysis conducted on geographies consisting of 194,665,835 people shows a poor negative correlation between the proportion of Immigrants from Iraq and household income with householder between the ages 25 and 44 in the United States with a correlation coefficient (R) of -0.103 and weighted average of $89,444, a difference of 6.0%.
Householder Income Ages 25 - 44 years Correlation Summary
| Measurement | Sudanese | Immigrants from Iraq |
| Minimum | $22,303 | $48,509 |
| Maximum | $117,632 | $144,841 |
| Range | $95,330 | $96,332 |
| Mean | $76,942 | $89,769 |
| Median | $82,204 | $88,796 |
| Interquartile 25% (IQ1) | $67,535 | $75,233 |
| Interquartile 75% (IQ3) | $87,340 | $100,185 |
| Interquartile Range (IQR) | $19,805 | $24,952 |
| Standard Deviation (Sample) | $20,185 | $18,567 |
| Standard Deviation (Population) | $20,027 | $18,451 |
Similar Demographics by Householder Income Ages 25 - 44 years
Demographics Similar to Sudanese by Householder Income Ages 25 - 44 years
In terms of householder income ages 25 - 44 years, the demographic groups most similar to Sudanese are Osage ($84,461, a difference of 0.070%), Immigrants from Cabo Verde ($84,304, a difference of 0.12%), Belizean ($84,534, a difference of 0.16%), Hmong ($84,258, a difference of 0.17%), and Cree ($84,574, a difference of 0.20%).
| Demographics | Rating | Rank | Householder Income Ages 25 - 44 years |
| Immigrants | Nicaragua | 0.5 /100 | #258 | Tragic $84,914 |
| Immigrants | Senegal | 0.5 /100 | #259 | Tragic $84,848 |
| Americans | 0.4 /100 | #260 | Tragic $84,791 |
| Inupiat | 0.4 /100 | #261 | Tragic $84,619 |
| Cree | 0.4 /100 | #262 | Tragic $84,574 |
| Belizeans | 0.4 /100 | #263 | Tragic $84,534 |
| Osage | 0.4 /100 | #264 | Tragic $84,461 |
| Sudanese | 0.4 /100 | #265 | Tragic $84,401 |
| Immigrants | Cabo Verde | 0.3 /100 | #266 | Tragic $84,304 |
| Hmong | 0.3 /100 | #267 | Tragic $84,258 |
| Sub-Saharan Africans | 0.3 /100 | #268 | Tragic $84,235 |
| Spanish American Indians | 0.3 /100 | #269 | Tragic $84,085 |
| Jamaicans | 0.3 /100 | #270 | Tragic $83,933 |
| Somalis | 0.2 /100 | #271 | Tragic $83,752 |
| Spanish Americans | 0.2 /100 | #272 | Tragic $83,722 |
Demographics Similar to Immigrants from Iraq by Householder Income Ages 25 - 44 years
In terms of householder income ages 25 - 44 years, the demographic groups most similar to Immigrants from Iraq are Immigrants from Panama ($89,451, a difference of 0.010%), Barbadian ($89,565, a difference of 0.14%), Immigrants from Guyana ($89,586, a difference of 0.16%), Immigrants from Ecuador ($89,673, a difference of 0.26%), and Immigrants from Trinidad and Tobago ($89,748, a difference of 0.34%).
| Demographics | Rating | Rank | Householder Income Ages 25 - 44 years |
| Delaware | 6.9 /100 | #219 | Tragic $89,876 |
| Trinidadians and Tobagonians | 6.8 /100 | #220 | Tragic $89,856 |
| Immigrants | Trinidad and Tobago | 6.5 /100 | #221 | Tragic $89,748 |
| Immigrants | Ecuador | 6.2 /100 | #222 | Tragic $89,673 |
| Immigrants | Guyana | 5.9 /100 | #223 | Tragic $89,586 |
| Barbadians | 5.9 /100 | #224 | Tragic $89,565 |
| Immigrants | Panama | 5.5 /100 | #225 | Tragic $89,451 |
| Immigrants | Iraq | 5.5 /100 | #226 | Tragic $89,444 |
| Immigrants | St. Vincent and the Grenadines | 4.1 /100 | #227 | Tragic $88,888 |
| Immigrants | Bosnia and Herzegovina | 4.0 /100 | #228 | Tragic $88,819 |
| Immigrants | Barbados | 3.7 /100 | #229 | Tragic $88,687 |
| Alaskan Athabascans | 3.3 /100 | #230 | Tragic $88,446 |
| Immigrants | Grenada | 3.0 /100 | #231 | Tragic $88,311 |
| Immigrants | Nonimmigrants | 3.0 /100 | #232 | Tragic $88,301 |
| Malaysians | 3.0 /100 | #233 | Tragic $88,291 |