Sudanese vs Immigrants from Uruguay Householder Income Over 65 years
COMPARE
Sudanese
Immigrants from Uruguay
Householder Income Over 65 years
Householder Income Over 65 years Comparison
Sudanese
Immigrants from Uruguay
$58,281
HOUSEHOLDER INCOME OVER 65 YEARS
5.7/ 100
METRIC RATING
217th/ 347
METRIC RANK
$56,975
HOUSEHOLDER INCOME OVER 65 YEARS
1.5/ 100
METRIC RATING
236th/ 347
METRIC RANK
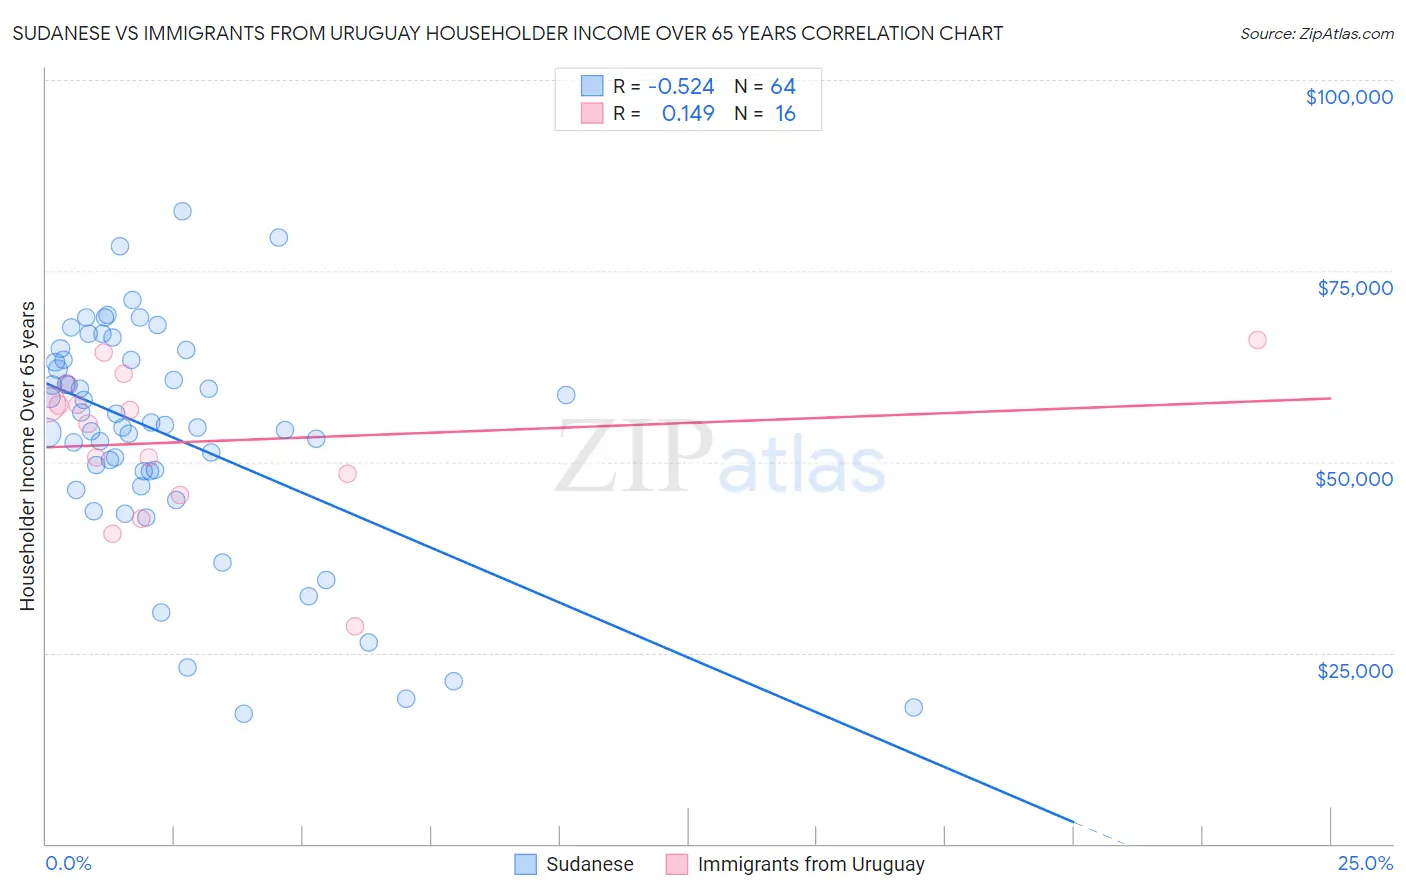
Sudanese vs Immigrants from Uruguay Householder Income Over 65 years Correlation Chart
The statistical analysis conducted on geographies consisting of 109,968,006 people shows a substantial negative correlation between the proportion of Sudanese and household income with householder over the age of 65 in the United States with a correlation coefficient (R) of -0.524 and weighted average of $58,281. Similarly, the statistical analysis conducted on geographies consisting of 133,209,862 people shows a poor positive correlation between the proportion of Immigrants from Uruguay and household income with householder over the age of 65 in the United States with a correlation coefficient (R) of 0.149 and weighted average of $56,975, a difference of 2.3%.
Householder Income Over 65 years Correlation Summary
| Measurement | Sudanese | Immigrants from Uruguay |
| Minimum | $17,083 | $28,542 |
| Maximum | $82,774 | $65,972 |
| Range | $65,691 | $37,430 |
| Mean | $53,447 | $52,708 |
| Median | $54,692 | $55,916 |
| Interquartile 25% (IQ1) | $47,752 | $47,054 |
| Interquartile 75% (IQ3) | $63,414 | $58,928 |
| Interquartile Range (IQR) | $15,662 | $11,874 |
| Standard Deviation (Sample) | $14,913 | $9,823 |
| Standard Deviation (Population) | $14,796 | $9,511 |
Demographics Similar to Sudanese and Immigrants from Uruguay by Householder Income Over 65 years
In terms of householder income over 65 years, the demographic groups most similar to Sudanese are Panamanian ($58,266, a difference of 0.030%), Malaysian ($58,244, a difference of 0.060%), Yugoslavian ($58,243, a difference of 0.070%), Immigrants from El Salvador ($58,226, a difference of 0.10%), and Delaware ($58,214, a difference of 0.11%). Similarly, the demographic groups most similar to Immigrants from Uruguay are Spanish American ($57,021, a difference of 0.080%), Immigrants from Burma/Myanmar ($57,114, a difference of 0.24%), Immigrants from Western Africa ($57,119, a difference of 0.25%), Immigrants from Venezuela ($57,371, a difference of 0.70%), and Nonimmigrants ($57,426, a difference of 0.79%).
| Demographics | Rating | Rank | Householder Income Over 65 years |
| Immigrants | Middle Africa | 6.2 /100 | #216 | Tragic $58,375 |
| Sudanese | 5.7 /100 | #217 | Tragic $58,281 |
| Panamanians | 5.6 /100 | #218 | Tragic $58,266 |
| Malaysians | 5.5 /100 | #219 | Tragic $58,244 |
| Yugoslavians | 5.5 /100 | #220 | Tragic $58,243 |
| Immigrants | El Salvador | 5.4 /100 | #221 | Tragic $58,226 |
| Delaware | 5.3 /100 | #222 | Tragic $58,214 |
| Tsimshian | 5.2 /100 | #223 | Tragic $58,202 |
| Bermudans | 5.1 /100 | #224 | Tragic $58,171 |
| Venezuelans | 4.4 /100 | #225 | Tragic $58,026 |
| French Canadians | 4.2 /100 | #226 | Tragic $57,975 |
| Japanese | 3.9 /100 | #227 | Tragic $57,919 |
| Immigrants | Albania | 3.6 /100 | #228 | Tragic $57,828 |
| Immigrants | Colombia | 3.0 /100 | #229 | Tragic $57,658 |
| Immigrants | Cambodia | 2.8 /100 | #230 | Tragic $57,580 |
| Immigrants | Nonimmigrants | 2.4 /100 | #231 | Tragic $57,426 |
| Immigrants | Venezuela | 2.3 /100 | #232 | Tragic $57,371 |
| Immigrants | Western Africa | 1.7 /100 | #233 | Tragic $57,119 |
| Immigrants | Burma/Myanmar | 1.7 /100 | #234 | Tragic $57,114 |
| Spanish Americans | 1.6 /100 | #235 | Tragic $57,021 |
| Immigrants | Uruguay | 1.5 /100 | #236 | Tragic $56,975 |