Sri Lankan vs American Householder Income Ages 25 - 44 years
COMPARE
Sri Lankan
American
Householder Income Ages 25 - 44 years
Householder Income Ages 25 - 44 years Comparison
Sri Lankans
Americans
$101,960
HOUSEHOLDER INCOME AGES 25 - 44 YEARS
98.4/ 100
METRIC RATING
94th/ 347
METRIC RANK
$84,791
HOUSEHOLDER INCOME AGES 25 - 44 YEARS
0.4/ 100
METRIC RATING
260th/ 347
METRIC RANK
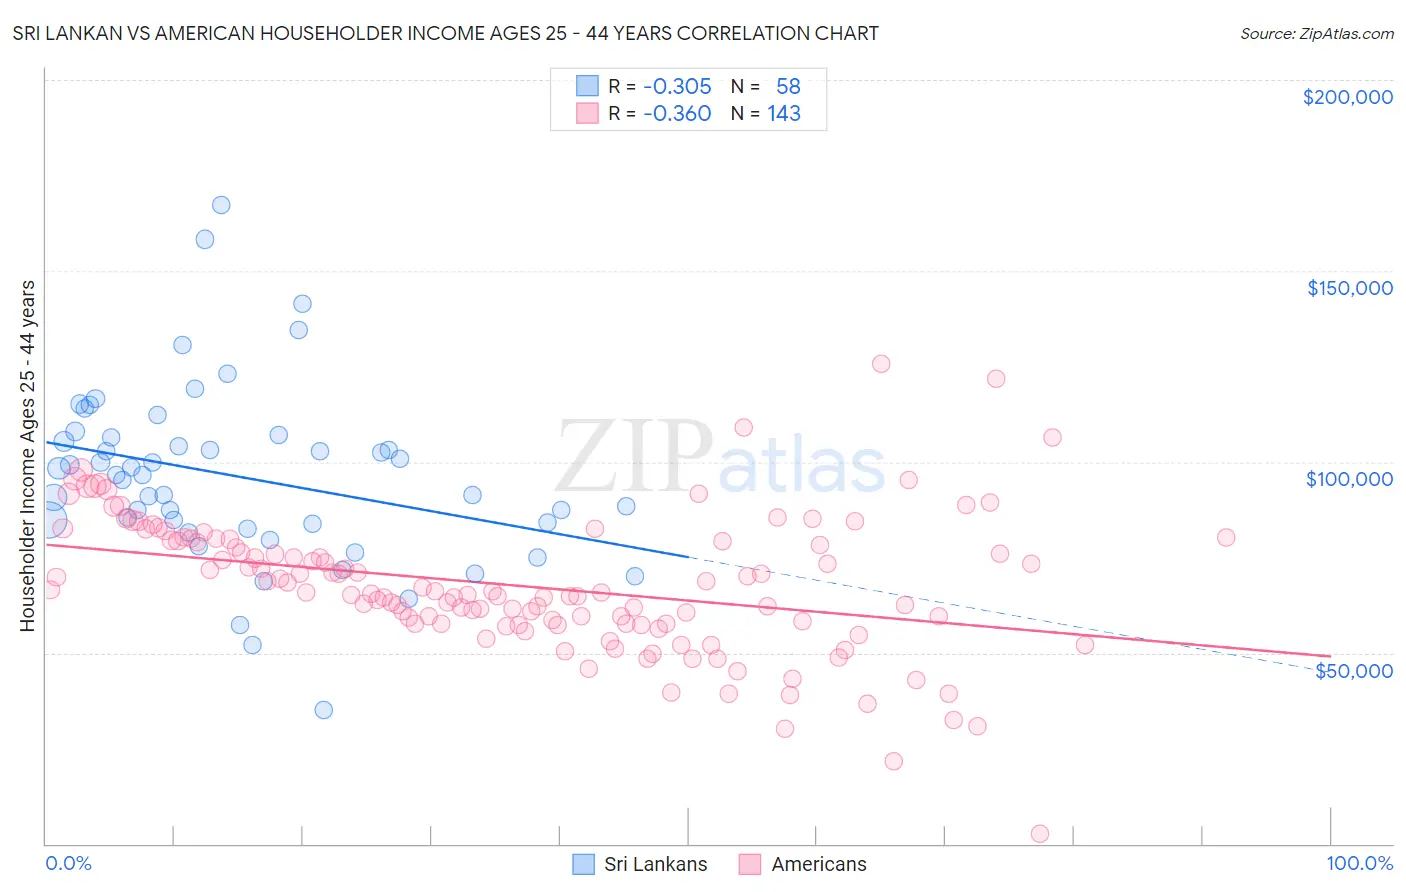
Sri Lankan vs American Householder Income Ages 25 - 44 years Correlation Chart
The statistical analysis conducted on geographies consisting of 439,036,637 people shows a mild negative correlation between the proportion of Sri Lankans and household income with householder between the ages 25 and 44 in the United States with a correlation coefficient (R) of -0.305 and weighted average of $101,960. Similarly, the statistical analysis conducted on geographies consisting of 574,694,718 people shows a mild negative correlation between the proportion of Americans and household income with householder between the ages 25 and 44 in the United States with a correlation coefficient (R) of -0.360 and weighted average of $84,791, a difference of 20.3%.
Householder Income Ages 25 - 44 years Correlation Summary
| Measurement | Sri Lankan | American |
| Minimum | $35,156 | $2,499 |
| Maximum | $167,132 | $125,750 |
| Range | $131,976 | $123,251 |
| Mean | $96,155 | $67,597 |
| Median | $96,605 | $65,930 |
| Interquartile 25% (IQ1) | $83,833 | $57,596 |
| Interquartile 75% (IQ3) | $106,327 | $79,418 |
| Interquartile Range (IQR) | $22,494 | $21,822 |
| Standard Deviation (Sample) | $23,383 | $18,011 |
| Standard Deviation (Population) | $23,180 | $17,948 |
Similar Demographics by Householder Income Ages 25 - 44 years
Demographics Similar to Sri Lankans by Householder Income Ages 25 - 44 years
In terms of householder income ages 25 - 44 years, the demographic groups most similar to Sri Lankans are Assyrian/Chaldean/Syriac ($101,936, a difference of 0.020%), Immigrants from England ($102,020, a difference of 0.060%), Macedonian ($101,882, a difference of 0.080%), Austrian ($101,842, a difference of 0.12%), and Immigrants from Kazakhstan ($101,727, a difference of 0.23%).
| Demographics | Rating | Rank | Householder Income Ages 25 - 44 years |
| Immigrants | Western Europe | 98.9 /100 | #87 | Exceptional $102,654 |
| Immigrants | Canada | 98.9 /100 | #88 | Exceptional $102,616 |
| Romanians | 98.8 /100 | #89 | Exceptional $102,544 |
| Ukrainians | 98.8 /100 | #90 | Exceptional $102,451 |
| Croatians | 98.7 /100 | #91 | Exceptional $102,414 |
| Immigrants | North America | 98.7 /100 | #92 | Exceptional $102,407 |
| Immigrants | England | 98.4 /100 | #93 | Exceptional $102,020 |
| Sri Lankans | 98.4 /100 | #94 | Exceptional $101,960 |
| Assyrians/Chaldeans/Syriacs | 98.3 /100 | #95 | Exceptional $101,936 |
| Macedonians | 98.3 /100 | #96 | Exceptional $101,882 |
| Austrians | 98.3 /100 | #97 | Exceptional $101,842 |
| Immigrants | Kazakhstan | 98.1 /100 | #98 | Exceptional $101,727 |
| Taiwanese | 97.9 /100 | #99 | Exceptional $101,492 |
| Immigrants | Argentina | 97.8 /100 | #100 | Exceptional $101,415 |
| Albanians | 97.8 /100 | #101 | Exceptional $101,367 |
Demographics Similar to Americans by Householder Income Ages 25 - 44 years
In terms of householder income ages 25 - 44 years, the demographic groups most similar to Americans are Immigrants from Senegal ($84,848, a difference of 0.070%), Immigrants from Nicaragua ($84,914, a difference of 0.14%), Inupiat ($84,619, a difference of 0.20%), Cree ($84,574, a difference of 0.26%), and Belizean ($84,534, a difference of 0.30%).
| Demographics | Rating | Rank | Householder Income Ages 25 - 44 years |
| British West Indians | 0.7 /100 | #253 | Tragic $85,565 |
| Immigrants | Laos | 0.7 /100 | #254 | Tragic $85,553 |
| German Russians | 0.6 /100 | #255 | Tragic $85,220 |
| Central Americans | 0.5 /100 | #256 | Tragic $85,144 |
| Mexican American Indians | 0.5 /100 | #257 | Tragic $85,066 |
| Immigrants | Nicaragua | 0.5 /100 | #258 | Tragic $84,914 |
| Immigrants | Senegal | 0.5 /100 | #259 | Tragic $84,848 |
| Americans | 0.4 /100 | #260 | Tragic $84,791 |
| Inupiat | 0.4 /100 | #261 | Tragic $84,619 |
| Cree | 0.4 /100 | #262 | Tragic $84,574 |
| Belizeans | 0.4 /100 | #263 | Tragic $84,534 |
| Osage | 0.4 /100 | #264 | Tragic $84,461 |
| Sudanese | 0.4 /100 | #265 | Tragic $84,401 |
| Immigrants | Cabo Verde | 0.3 /100 | #266 | Tragic $84,304 |
| Hmong | 0.3 /100 | #267 | Tragic $84,258 |