Sri Lankan vs Cambodian Householder Income Ages 25 - 44 years
COMPARE
Sri Lankan
Cambodian
Householder Income Ages 25 - 44 years
Householder Income Ages 25 - 44 years Comparison
Sri Lankans
Cambodians
$101,960
HOUSEHOLDER INCOME AGES 25 - 44 YEARS
98.4/ 100
METRIC RATING
94th/ 347
METRIC RANK
$107,148
HOUSEHOLDER INCOME AGES 25 - 44 YEARS
99.9/ 100
METRIC RATING
50th/ 347
METRIC RANK
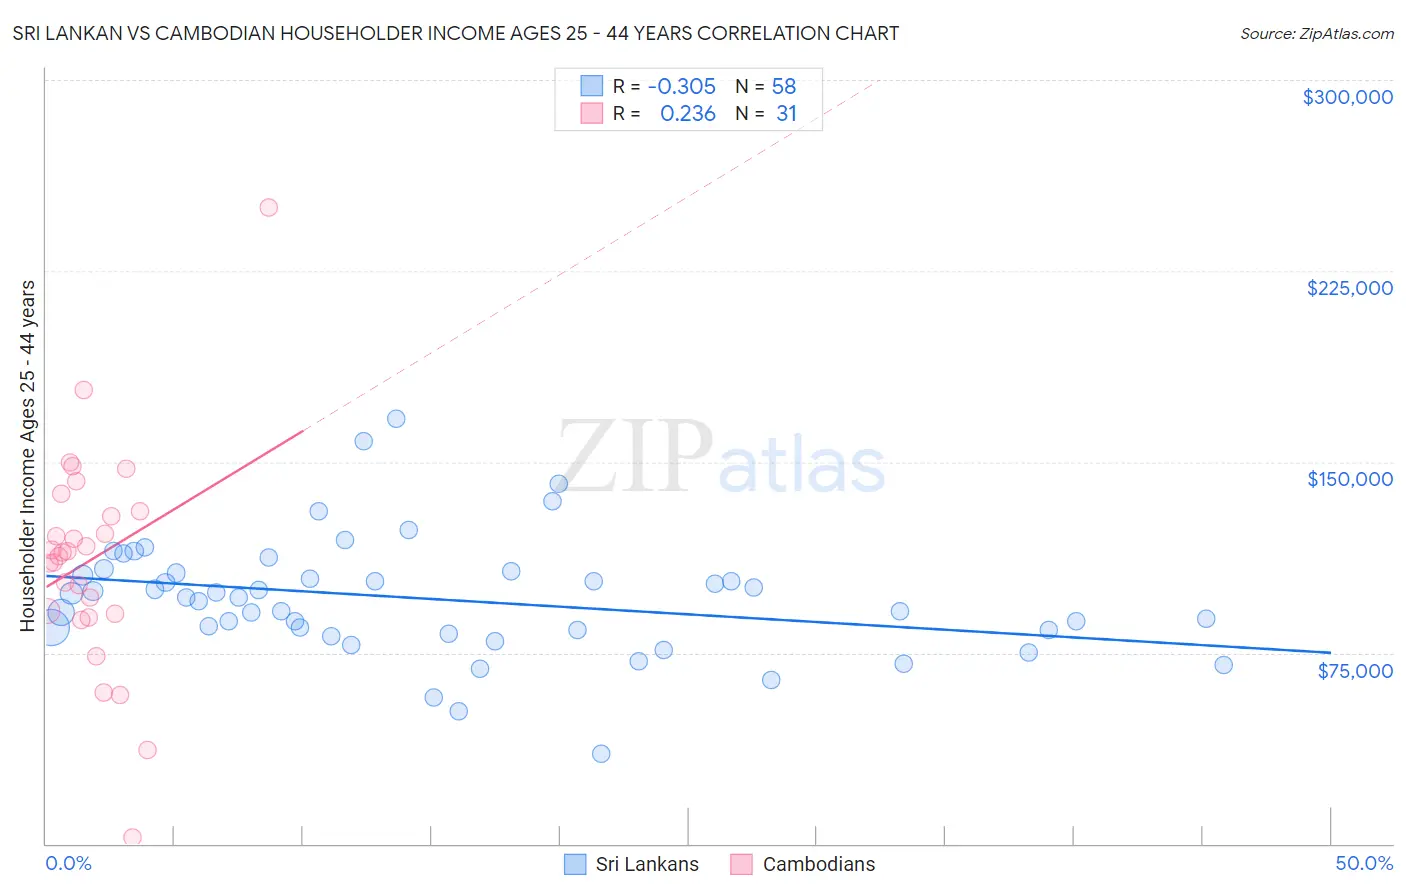
Sri Lankan vs Cambodian Householder Income Ages 25 - 44 years Correlation Chart
The statistical analysis conducted on geographies consisting of 439,036,637 people shows a mild negative correlation between the proportion of Sri Lankans and household income with householder between the ages 25 and 44 in the United States with a correlation coefficient (R) of -0.305 and weighted average of $101,960. Similarly, the statistical analysis conducted on geographies consisting of 102,421,447 people shows a weak positive correlation between the proportion of Cambodians and household income with householder between the ages 25 and 44 in the United States with a correlation coefficient (R) of 0.236 and weighted average of $107,148, a difference of 5.1%.
Householder Income Ages 25 - 44 years Correlation Summary
| Measurement | Sri Lankan | Cambodian |
| Minimum | $35,156 | $2,499 |
| Maximum | $167,132 | $250,001 |
| Range | $131,976 | $247,502 |
| Mean | $96,155 | $111,649 |
| Median | $96,605 | $114,305 |
| Interquartile 25% (IQ1) | $83,833 | $90,341 |
| Interquartile 75% (IQ3) | $106,327 | $130,756 |
| Interquartile Range (IQR) | $22,494 | $40,415 |
| Standard Deviation (Sample) | $23,383 | $43,612 |
| Standard Deviation (Population) | $23,180 | $42,903 |
Similar Demographics by Householder Income Ages 25 - 44 years
Demographics Similar to Sri Lankans by Householder Income Ages 25 - 44 years
In terms of householder income ages 25 - 44 years, the demographic groups most similar to Sri Lankans are Assyrian/Chaldean/Syriac ($101,936, a difference of 0.020%), Immigrants from England ($102,020, a difference of 0.060%), Macedonian ($101,882, a difference of 0.080%), Austrian ($101,842, a difference of 0.12%), and Immigrants from Kazakhstan ($101,727, a difference of 0.23%).
| Demographics | Rating | Rank | Householder Income Ages 25 - 44 years |
| Immigrants | Western Europe | 98.9 /100 | #87 | Exceptional $102,654 |
| Immigrants | Canada | 98.9 /100 | #88 | Exceptional $102,616 |
| Romanians | 98.8 /100 | #89 | Exceptional $102,544 |
| Ukrainians | 98.8 /100 | #90 | Exceptional $102,451 |
| Croatians | 98.7 /100 | #91 | Exceptional $102,414 |
| Immigrants | North America | 98.7 /100 | #92 | Exceptional $102,407 |
| Immigrants | England | 98.4 /100 | #93 | Exceptional $102,020 |
| Sri Lankans | 98.4 /100 | #94 | Exceptional $101,960 |
| Assyrians/Chaldeans/Syriacs | 98.3 /100 | #95 | Exceptional $101,936 |
| Macedonians | 98.3 /100 | #96 | Exceptional $101,882 |
| Austrians | 98.3 /100 | #97 | Exceptional $101,842 |
| Immigrants | Kazakhstan | 98.1 /100 | #98 | Exceptional $101,727 |
| Taiwanese | 97.9 /100 | #99 | Exceptional $101,492 |
| Immigrants | Argentina | 97.8 /100 | #100 | Exceptional $101,415 |
| Albanians | 97.8 /100 | #101 | Exceptional $101,367 |
Demographics Similar to Cambodians by Householder Income Ages 25 - 44 years
In terms of householder income ages 25 - 44 years, the demographic groups most similar to Cambodians are Immigrants from Turkey ($107,258, a difference of 0.10%), Estonian ($107,269, a difference of 0.11%), Bulgarian ($107,264, a difference of 0.11%), Immigrants from Belarus ($107,393, a difference of 0.23%), and Immigrants from Czechoslovakia ($106,888, a difference of 0.24%).
| Demographics | Rating | Rank | Householder Income Ages 25 - 44 years |
| Immigrants | Malaysia | 99.9 /100 | #43 | Exceptional $107,650 |
| Immigrants | Indonesia | 99.9 /100 | #44 | Exceptional $107,627 |
| Israelis | 99.9 /100 | #45 | Exceptional $107,579 |
| Immigrants | Belarus | 99.9 /100 | #46 | Exceptional $107,393 |
| Estonians | 99.9 /100 | #47 | Exceptional $107,269 |
| Bulgarians | 99.9 /100 | #48 | Exceptional $107,264 |
| Immigrants | Turkey | 99.9 /100 | #49 | Exceptional $107,258 |
| Cambodians | 99.9 /100 | #50 | Exceptional $107,148 |
| Immigrants | Czechoslovakia | 99.9 /100 | #51 | Exceptional $106,888 |
| Immigrants | Europe | 99.9 /100 | #52 | Exceptional $106,817 |
| Immigrants | Norway | 99.9 /100 | #53 | Exceptional $106,629 |
| Paraguayans | 99.9 /100 | #54 | Exceptional $106,615 |
| Greeks | 99.9 /100 | #55 | Exceptional $106,457 |
| Immigrants | Pakistan | 99.8 /100 | #56 | Exceptional $106,129 |
| Immigrants | Austria | 99.8 /100 | #57 | Exceptional $106,103 |