Northern European vs Seminole Per Capita Income
COMPARE
Northern European
Seminole
Per Capita Income
Per Capita Income Comparison
Northern Europeans
Seminole
$47,698
PER CAPITA INCOME
98.9/ 100
METRIC RATING
89th/ 347
METRIC RANK
$36,180
PER CAPITA INCOME
0.0/ 100
METRIC RATING
314th/ 347
METRIC RANK
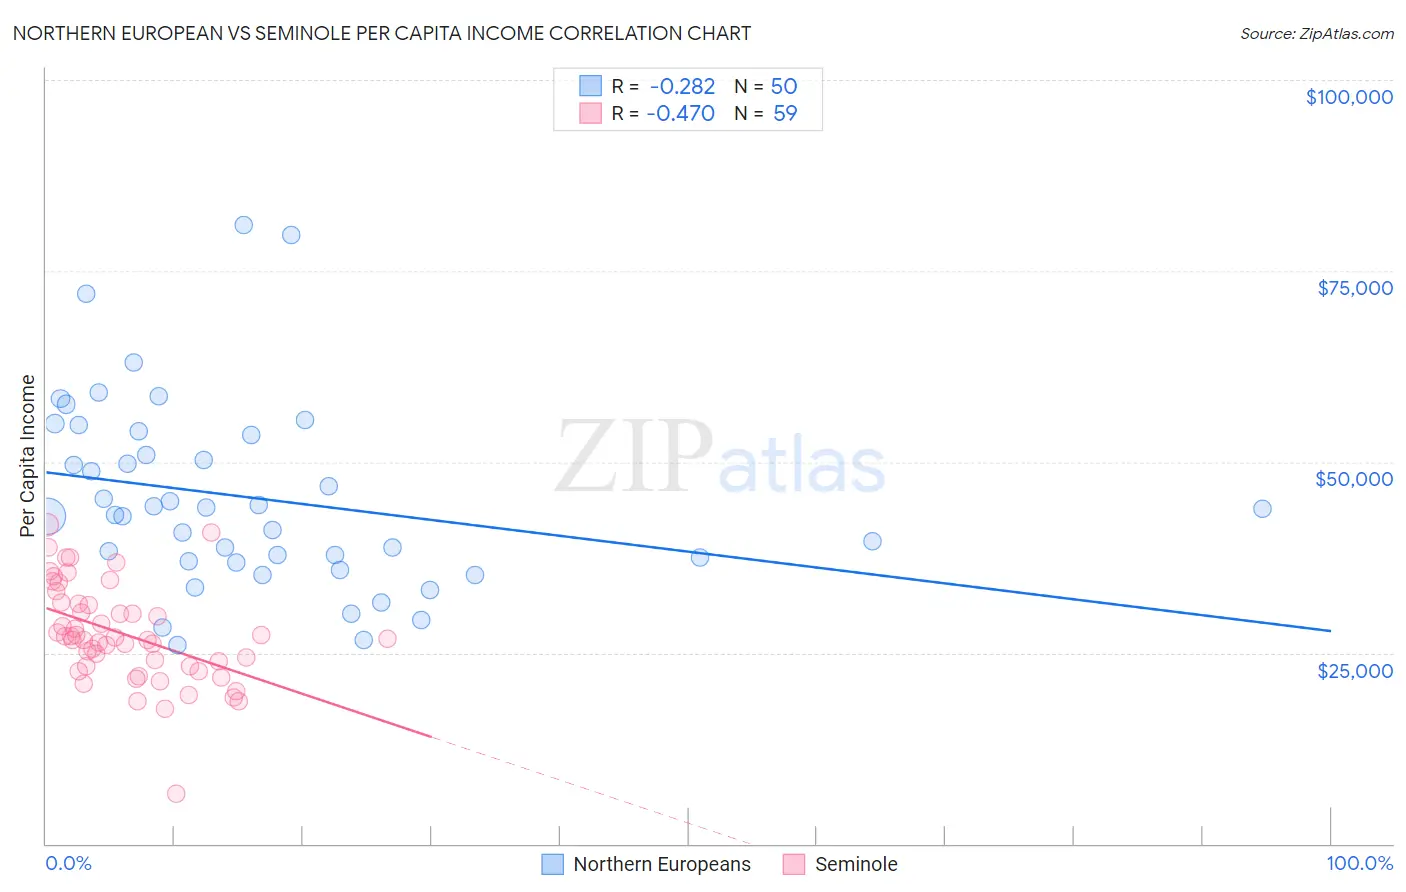
Northern European vs Seminole Per Capita Income Correlation Chart
The statistical analysis conducted on geographies consisting of 406,105,495 people shows a weak negative correlation between the proportion of Northern Europeans and per capita income in the United States with a correlation coefficient (R) of -0.282 and weighted average of $47,698. Similarly, the statistical analysis conducted on geographies consisting of 118,313,864 people shows a moderate negative correlation between the proportion of Seminole and per capita income in the United States with a correlation coefficient (R) of -0.470 and weighted average of $36,180, a difference of 31.8%.
Per Capita Income Correlation Summary
| Measurement | Northern European | Seminole |
| Minimum | $26,062 | $6,596 |
| Maximum | $80,940 | $41,755 |
| Range | $54,878 | $35,159 |
| Mean | $45,254 | $27,427 |
| Median | $43,430 | $26,891 |
| Interquartile 25% (IQ1) | $36,923 | $23,175 |
| Interquartile 75% (IQ3) | $53,441 | $31,374 |
| Interquartile Range (IQR) | $16,518 | $8,199 |
| Standard Deviation (Sample) | $12,375 | $6,480 |
| Standard Deviation (Population) | $12,250 | $6,425 |
Similar Demographics by Per Capita Income
Demographics Similar to Northern Europeans by Per Capita Income
In terms of per capita income, the demographic groups most similar to Northern Europeans are Croatian ($47,742, a difference of 0.090%), Italian ($47,574, a difference of 0.26%), Macedonian ($47,573, a difference of 0.26%), Immigrants from Moldova ($47,489, a difference of 0.44%), and Immigrants from Zimbabwe ($47,394, a difference of 0.64%).
| Demographics | Rating | Rank | Per Capita Income |
| Immigrants | Indonesia | 99.4 /100 | #82 | Exceptional $48,195 |
| Immigrants | Brazil | 99.4 /100 | #83 | Exceptional $48,164 |
| Immigrants | Ukraine | 99.3 /100 | #84 | Exceptional $48,134 |
| Austrians | 99.3 /100 | #85 | Exceptional $48,116 |
| Immigrants | Southern Europe | 99.3 /100 | #86 | Exceptional $48,027 |
| Ukrainians | 99.3 /100 | #87 | Exceptional $48,014 |
| Croatians | 99.0 /100 | #88 | Exceptional $47,742 |
| Northern Europeans | 98.9 /100 | #89 | Exceptional $47,698 |
| Italians | 98.8 /100 | #90 | Exceptional $47,574 |
| Macedonians | 98.8 /100 | #91 | Exceptional $47,573 |
| Immigrants | Moldova | 98.7 /100 | #92 | Exceptional $47,489 |
| Immigrants | Zimbabwe | 98.5 /100 | #93 | Exceptional $47,394 |
| Albanians | 98.5 /100 | #94 | Exceptional $47,379 |
| Immigrants | Egypt | 98.5 /100 | #95 | Exceptional $47,361 |
| Alsatians | 98.3 /100 | #96 | Exceptional $47,284 |
Demographics Similar to Seminole by Per Capita Income
In terms of per capita income, the demographic groups most similar to Seminole are Yaqui ($36,112, a difference of 0.19%), Choctaw ($35,999, a difference of 0.50%), Bahamian ($36,427, a difference of 0.68%), Dutch West Indian ($35,922, a difference of 0.72%), and Bangladeshi ($35,897, a difference of 0.79%).
| Demographics | Rating | Rank | Per Capita Income |
| Immigrants | Latin America | 0.0 /100 | #307 | Tragic $36,823 |
| Fijians | 0.0 /100 | #308 | Tragic $36,690 |
| Immigrants | Honduras | 0.0 /100 | #309 | Tragic $36,665 |
| Ute | 0.0 /100 | #310 | Tragic $36,651 |
| Chippewa | 0.0 /100 | #311 | Tragic $36,631 |
| Chickasaw | 0.0 /100 | #312 | Tragic $36,475 |
| Bahamians | 0.0 /100 | #313 | Tragic $36,427 |
| Seminole | 0.0 /100 | #314 | Tragic $36,180 |
| Yaqui | 0.0 /100 | #315 | Tragic $36,112 |
| Choctaw | 0.0 /100 | #316 | Tragic $35,999 |
| Dutch West Indians | 0.0 /100 | #317 | Tragic $35,922 |
| Bangladeshis | 0.0 /100 | #318 | Tragic $35,897 |
| Immigrants | Congo | 0.0 /100 | #319 | Tragic $35,720 |
| Hispanics or Latinos | 0.0 /100 | #320 | Tragic $35,688 |
| Blacks/African Americans | 0.0 /100 | #321 | Tragic $35,564 |