Spanish vs Immigrants from Norway Median Family Income
COMPARE
Spanish
Immigrants from Norway
Median Family Income
Median Family Income Comparison
Spanish
Immigrants from Norway
$99,977
MEDIAN FAMILY INCOME
20.1/ 100
METRIC RATING
200th/ 347
METRIC RANK
$115,847
MEDIAN FAMILY INCOME
99.9/ 100
METRIC RATING
53rd/ 347
METRIC RANK
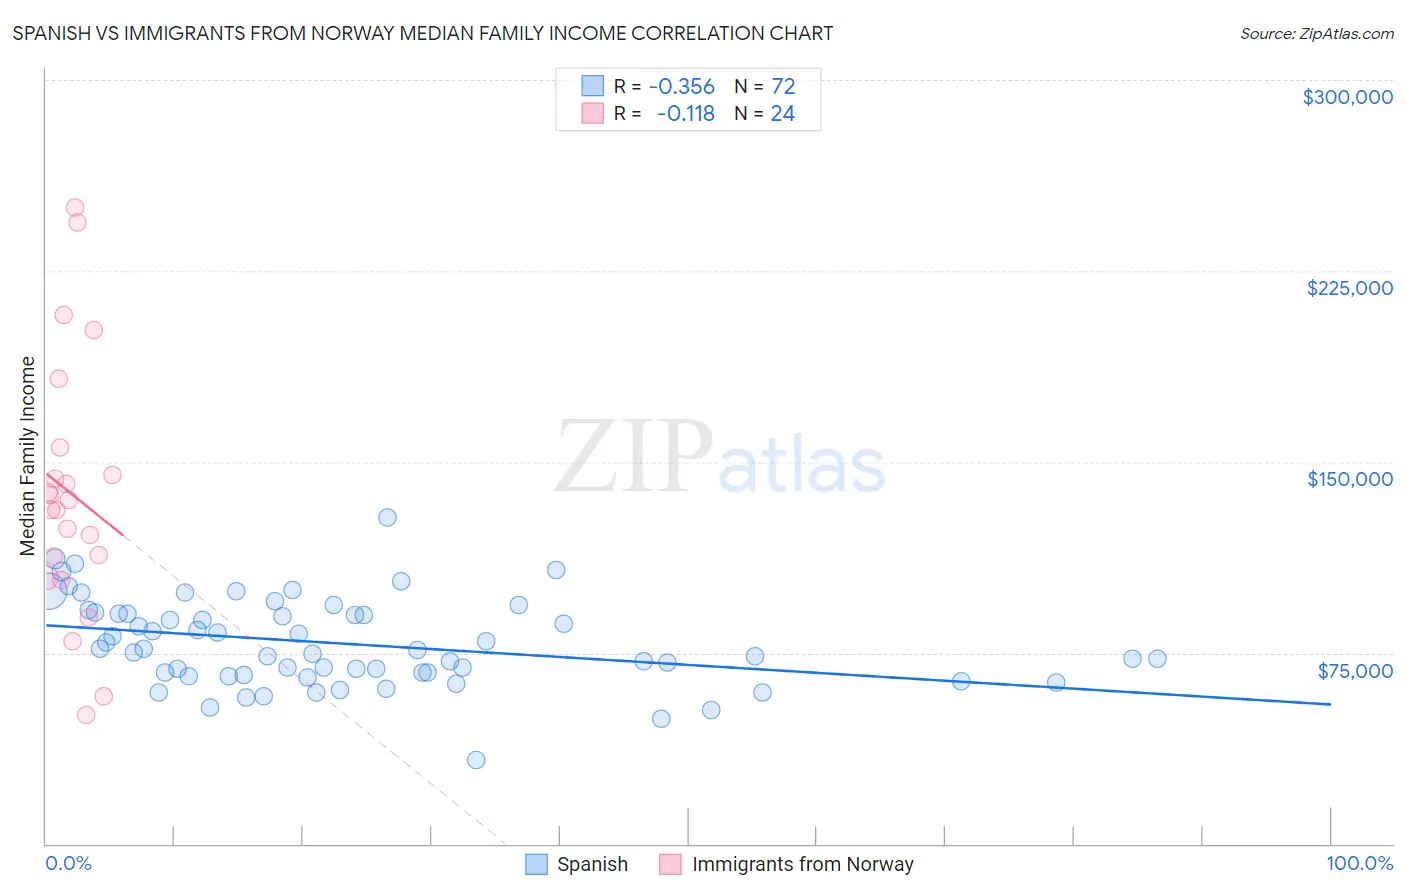
Spanish vs Immigrants from Norway Median Family Income Correlation Chart
The statistical analysis conducted on geographies consisting of 421,758,667 people shows a mild negative correlation between the proportion of Spanish and median family income in the United States with a correlation coefficient (R) of -0.356 and weighted average of $99,977. Similarly, the statistical analysis conducted on geographies consisting of 116,680,488 people shows a poor negative correlation between the proportion of Immigrants from Norway and median family income in the United States with a correlation coefficient (R) of -0.118 and weighted average of $115,847, a difference of 15.9%.
Median Family Income Correlation Summary
| Measurement | Spanish | Immigrants from Norway |
| Minimum | $32,992 | $50,417 |
| Maximum | $127,945 | $250,001 |
| Range | $94,953 | $199,584 |
| Mean | $78,597 | $137,530 |
| Median | $75,704 | $133,287 |
| Interquartile 25% (IQ1) | $66,829 | $108,664 |
| Interquartile 75% (IQ3) | $90,296 | $150,184 |
| Interquartile Range (IQR) | $23,466 | $41,519 |
| Standard Deviation (Sample) | $17,174 | $50,729 |
| Standard Deviation (Population) | $17,054 | $49,661 |
Similar Demographics by Median Family Income
Demographics Similar to Spanish by Median Family Income
In terms of median family income, the demographic groups most similar to Spanish are Yugoslavian ($100,119, a difference of 0.14%), Immigrants from Thailand ($99,840, a difference of 0.14%), White/Caucasian ($99,800, a difference of 0.18%), Immigrants from Africa ($100,256, a difference of 0.28%), and Immigrants from Cameroon ($100,289, a difference of 0.31%).
| Demographics | Rating | Rank | Median Family Income |
| Iraqis | 26.3 /100 | #193 | Fair $100,658 |
| Uruguayans | 26.3 /100 | #194 | Fair $100,656 |
| Immigrants | South America | 23.9 /100 | #195 | Fair $100,414 |
| Samoans | 23.3 /100 | #196 | Fair $100,344 |
| Immigrants | Cameroon | 22.8 /100 | #197 | Fair $100,289 |
| Immigrants | Africa | 22.5 /100 | #198 | Fair $100,256 |
| Yugoslavians | 21.3 /100 | #199 | Fair $100,119 |
| Spanish | 20.1 /100 | #200 | Fair $99,977 |
| Immigrants | Thailand | 19.0 /100 | #201 | Poor $99,840 |
| Whites/Caucasians | 18.7 /100 | #202 | Poor $99,800 |
| Scotch-Irish | 17.1 /100 | #203 | Poor $99,591 |
| Ghanaians | 12.6 /100 | #204 | Poor $98,877 |
| Hawaiians | 12.5 /100 | #205 | Poor $98,869 |
| Immigrants | Iraq | 12.1 /100 | #206 | Poor $98,786 |
| Aleuts | 11.6 /100 | #207 | Poor $98,702 |
Demographics Similar to Immigrants from Norway by Median Family Income
In terms of median family income, the demographic groups most similar to Immigrants from Norway are Maltese ($115,862, a difference of 0.010%), Immigrants from Malaysia ($115,880, a difference of 0.030%), Immigrants from Czechoslovakia ($116,165, a difference of 0.27%), Immigrants from Europe ($115,523, a difference of 0.28%), and Chinese ($116,188, a difference of 0.29%).
| Demographics | Rating | Rank | Median Family Income |
| Immigrants | Russia | 99.9 /100 | #46 | Exceptional $116,942 |
| Immigrants | Austria | 99.9 /100 | #47 | Exceptional $116,830 |
| Immigrants | South Africa | 99.9 /100 | #48 | Exceptional $116,286 |
| Chinese | 99.9 /100 | #49 | Exceptional $116,188 |
| Immigrants | Czechoslovakia | 99.9 /100 | #50 | Exceptional $116,165 |
| Immigrants | Malaysia | 99.9 /100 | #51 | Exceptional $115,880 |
| Maltese | 99.9 /100 | #52 | Exceptional $115,862 |
| Immigrants | Norway | 99.9 /100 | #53 | Exceptional $115,847 |
| Immigrants | Europe | 99.9 /100 | #54 | Exceptional $115,523 |
| Lithuanians | 99.8 /100 | #55 | Exceptional $115,395 |
| New Zealanders | 99.8 /100 | #56 | Exceptional $115,230 |
| Greeks | 99.8 /100 | #57 | Exceptional $115,192 |
| Immigrants | Indonesia | 99.8 /100 | #58 | Exceptional $115,162 |
| Immigrants | Netherlands | 99.8 /100 | #59 | Exceptional $114,987 |
| Immigrants | Latvia | 99.8 /100 | #60 | Exceptional $114,826 |