Spanish vs Immigrants from Argentina Median Family Income
COMPARE
Spanish
Immigrants from Argentina
Median Family Income
Median Family Income Comparison
Spanish
Immigrants from Argentina
$99,977
MEDIAN FAMILY INCOME
20.1/ 100
METRIC RATING
200th/ 347
METRIC RANK
$110,873
MEDIAN FAMILY INCOME
98.5/ 100
METRIC RATING
89th/ 347
METRIC RANK
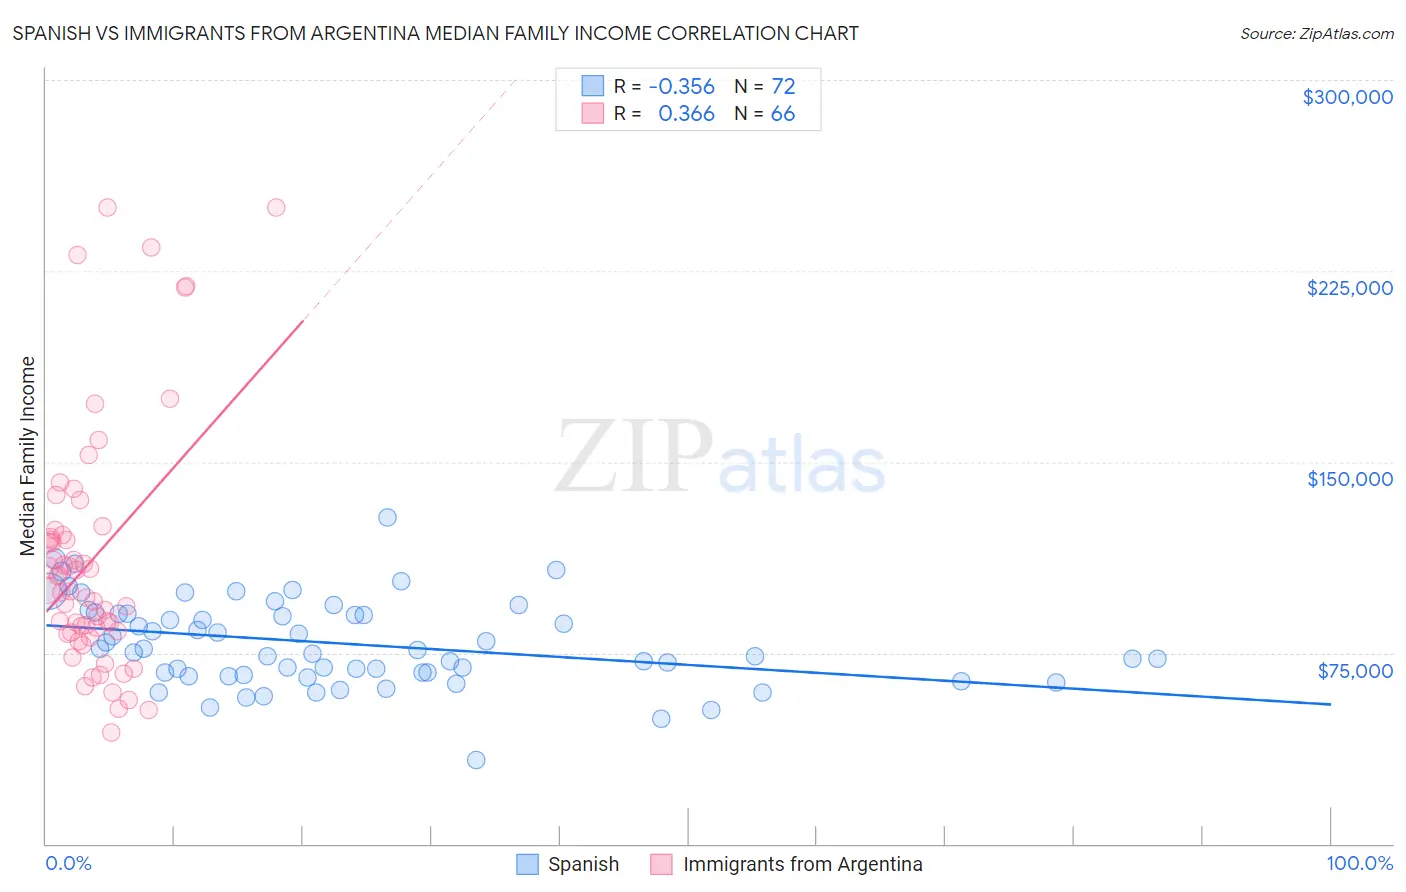
Spanish vs Immigrants from Argentina Median Family Income Correlation Chart
The statistical analysis conducted on geographies consisting of 421,758,667 people shows a mild negative correlation between the proportion of Spanish and median family income in the United States with a correlation coefficient (R) of -0.356 and weighted average of $99,977. Similarly, the statistical analysis conducted on geographies consisting of 264,326,105 people shows a mild positive correlation between the proportion of Immigrants from Argentina and median family income in the United States with a correlation coefficient (R) of 0.366 and weighted average of $110,873, a difference of 10.9%.
Median Family Income Correlation Summary
| Measurement | Spanish | Immigrants from Argentina |
| Minimum | $32,992 | $43,750 |
| Maximum | $127,945 | $250,001 |
| Range | $94,953 | $206,251 |
| Mean | $78,597 | $111,446 |
| Median | $75,704 | $99,402 |
| Interquartile 25% (IQ1) | $66,829 | $83,128 |
| Interquartile 75% (IQ3) | $90,296 | $121,234 |
| Interquartile Range (IQR) | $23,466 | $38,106 |
| Standard Deviation (Sample) | $17,174 | $47,916 |
| Standard Deviation (Population) | $17,054 | $47,552 |
Similar Demographics by Median Family Income
Demographics Similar to Spanish by Median Family Income
In terms of median family income, the demographic groups most similar to Spanish are Yugoslavian ($100,119, a difference of 0.14%), Immigrants from Thailand ($99,840, a difference of 0.14%), White/Caucasian ($99,800, a difference of 0.18%), Immigrants from Africa ($100,256, a difference of 0.28%), and Immigrants from Cameroon ($100,289, a difference of 0.31%).
| Demographics | Rating | Rank | Median Family Income |
| Iraqis | 26.3 /100 | #193 | Fair $100,658 |
| Uruguayans | 26.3 /100 | #194 | Fair $100,656 |
| Immigrants | South America | 23.9 /100 | #195 | Fair $100,414 |
| Samoans | 23.3 /100 | #196 | Fair $100,344 |
| Immigrants | Cameroon | 22.8 /100 | #197 | Fair $100,289 |
| Immigrants | Africa | 22.5 /100 | #198 | Fair $100,256 |
| Yugoslavians | 21.3 /100 | #199 | Fair $100,119 |
| Spanish | 20.1 /100 | #200 | Fair $99,977 |
| Immigrants | Thailand | 19.0 /100 | #201 | Poor $99,840 |
| Whites/Caucasians | 18.7 /100 | #202 | Poor $99,800 |
| Scotch-Irish | 17.1 /100 | #203 | Poor $99,591 |
| Ghanaians | 12.6 /100 | #204 | Poor $98,877 |
| Hawaiians | 12.5 /100 | #205 | Poor $98,869 |
| Immigrants | Iraq | 12.1 /100 | #206 | Poor $98,786 |
| Aleuts | 11.6 /100 | #207 | Poor $98,702 |
Demographics Similar to Immigrants from Argentina by Median Family Income
In terms of median family income, the demographic groups most similar to Immigrants from Argentina are Northern European ($110,635, a difference of 0.21%), Immigrants from Southern Europe ($110,614, a difference of 0.23%), Romanian ($111,243, a difference of 0.33%), Austrian ($111,306, a difference of 0.39%), and Croatian ($111,370, a difference of 0.45%).
| Demographics | Rating | Rank | Median Family Income |
| Immigrants | England | 99.2 /100 | #82 | Exceptional $112,038 |
| Immigrants | Egypt | 99.0 /100 | #83 | Exceptional $111,689 |
| Immigrants | Hungary | 98.8 /100 | #84 | Exceptional $111,378 |
| Croatians | 98.8 /100 | #85 | Exceptional $111,370 |
| Ukrainians | 98.8 /100 | #86 | Exceptional $111,368 |
| Austrians | 98.8 /100 | #87 | Exceptional $111,306 |
| Romanians | 98.8 /100 | #88 | Exceptional $111,243 |
| Immigrants | Argentina | 98.5 /100 | #89 | Exceptional $110,873 |
| Northern Europeans | 98.3 /100 | #90 | Exceptional $110,635 |
| Immigrants | Southern Europe | 98.3 /100 | #91 | Exceptional $110,614 |
| Immigrants | Lebanon | 97.9 /100 | #92 | Exceptional $110,159 |
| Immigrants | Kazakhstan | 97.8 /100 | #93 | Exceptional $110,137 |
| Koreans | 97.8 /100 | #94 | Exceptional $110,103 |
| Zimbabweans | 97.7 /100 | #95 | Exceptional $110,011 |
| Immigrants | Moldova | 97.7 /100 | #96 | Exceptional $109,975 |