Spanish American vs Immigrants from Congo Householder Income Ages 25 - 44 years
COMPARE
Spanish American
Immigrants from Congo
Householder Income Ages 25 - 44 years
Householder Income Ages 25 - 44 years Comparison
Spanish Americans
Immigrants from Congo
$83,722
HOUSEHOLDER INCOME AGES 25 - 44 YEARS
0.2/ 100
METRIC RATING
272nd/ 347
METRIC RANK
$72,178
HOUSEHOLDER INCOME AGES 25 - 44 YEARS
0.0/ 100
METRIC RATING
340th/ 347
METRIC RANK
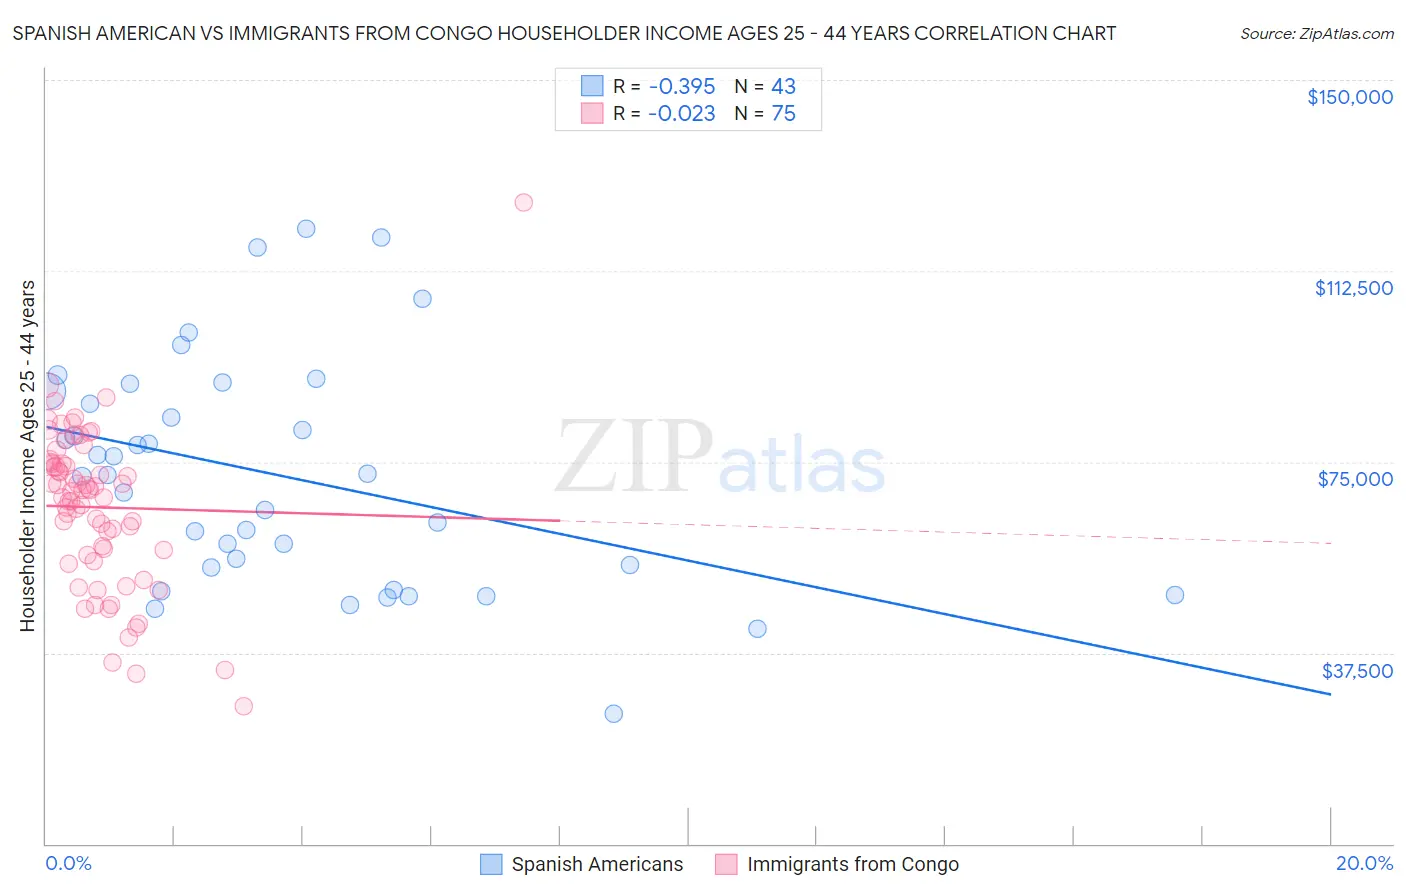
Spanish American vs Immigrants from Congo Householder Income Ages 25 - 44 years Correlation Chart
The statistical analysis conducted on geographies consisting of 103,075,966 people shows a mild negative correlation between the proportion of Spanish Americans and household income with householder between the ages 25 and 44 in the United States with a correlation coefficient (R) of -0.395 and weighted average of $83,722. Similarly, the statistical analysis conducted on geographies consisting of 92,043,798 people shows no correlation between the proportion of Immigrants from Congo and household income with householder between the ages 25 and 44 in the United States with a correlation coefficient (R) of -0.023 and weighted average of $72,178, a difference of 16.0%.
Householder Income Ages 25 - 44 years Correlation Summary
| Measurement | Spanish American | Immigrants from Congo |
| Minimum | $25,625 | $27,125 |
| Maximum | $120,725 | $125,889 |
| Range | $95,100 | $98,764 |
| Mean | $72,343 | $66,077 |
| Median | $72,340 | $69,302 |
| Interquartile 25% (IQ1) | $54,252 | $56,796 |
| Interquartile 75% (IQ3) | $88,756 | $74,591 |
| Interquartile Range (IQR) | $34,503 | $17,795 |
| Standard Deviation (Sample) | $22,283 | $15,700 |
| Standard Deviation (Population) | $22,022 | $15,595 |
Similar Demographics by Householder Income Ages 25 - 44 years
Demographics Similar to Spanish Americans by Householder Income Ages 25 - 44 years
In terms of householder income ages 25 - 44 years, the demographic groups most similar to Spanish Americans are Somali ($83,752, a difference of 0.040%), Iroquois ($83,682, a difference of 0.050%), Marshallese ($83,575, a difference of 0.18%), Jamaican ($83,933, a difference of 0.25%), and Spanish American Indian ($84,085, a difference of 0.43%).
| Demographics | Rating | Rank | Householder Income Ages 25 - 44 years |
| Sudanese | 0.4 /100 | #265 | Tragic $84,401 |
| Immigrants | Cabo Verde | 0.3 /100 | #266 | Tragic $84,304 |
| Hmong | 0.3 /100 | #267 | Tragic $84,258 |
| Sub-Saharan Africans | 0.3 /100 | #268 | Tragic $84,235 |
| Spanish American Indians | 0.3 /100 | #269 | Tragic $84,085 |
| Jamaicans | 0.3 /100 | #270 | Tragic $83,933 |
| Somalis | 0.2 /100 | #271 | Tragic $83,752 |
| Spanish Americans | 0.2 /100 | #272 | Tragic $83,722 |
| Iroquois | 0.2 /100 | #273 | Tragic $83,682 |
| Marshallese | 0.2 /100 | #274 | Tragic $83,575 |
| Immigrants | Jamaica | 0.2 /100 | #275 | Tragic $83,298 |
| Immigrants | Belize | 0.2 /100 | #276 | Tragic $83,141 |
| Paiute | 0.2 /100 | #277 | Tragic $82,984 |
| Senegalese | 0.2 /100 | #278 | Tragic $82,852 |
| Pima | 0.1 /100 | #279 | Tragic $82,821 |
Demographics Similar to Immigrants from Congo by Householder Income Ages 25 - 44 years
In terms of householder income ages 25 - 44 years, the demographic groups most similar to Immigrants from Congo are Arapaho ($71,697, a difference of 0.67%), Yuman ($72,956, a difference of 1.1%), Crow ($71,337, a difference of 1.2%), Immigrants from Yemen ($73,043, a difference of 1.2%), and Black/African American ($73,370, a difference of 1.7%).
| Demographics | Rating | Rank | Householder Income Ages 25 - 44 years |
| Hopi | 0.0 /100 | #333 | Tragic $75,002 |
| Creek | 0.0 /100 | #334 | Tragic $74,847 |
| Kiowa | 0.0 /100 | #335 | Tragic $74,776 |
| Yup'ik | 0.0 /100 | #336 | Tragic $73,688 |
| Blacks/African Americans | 0.0 /100 | #337 | Tragic $73,370 |
| Immigrants | Yemen | 0.0 /100 | #338 | Tragic $73,043 |
| Yuman | 0.0 /100 | #339 | Tragic $72,956 |
| Immigrants | Congo | 0.0 /100 | #340 | Tragic $72,178 |
| Arapaho | 0.0 /100 | #341 | Tragic $71,697 |
| Crow | 0.0 /100 | #342 | Tragic $71,337 |
| Tohono O'odham | 0.0 /100 | #343 | Tragic $69,068 |
| Pueblo | 0.0 /100 | #344 | Tragic $68,910 |
| Navajo | 0.0 /100 | #345 | Tragic $66,529 |
| Puerto Ricans | 0.0 /100 | #346 | Tragic $65,996 |
| Lumbee | 0.0 /100 | #347 | Tragic $60,305 |