Spanish American vs Immigrants from Congo Family Households with Children
COMPARE
Spanish American
Immigrants from Congo
Family Households with Children
Family Households with Children Comparison
Spanish Americans
Immigrants from Congo
27.4%
FAMILY HOUSEHOLDS WITH CHILDREN
48.9/ 100
METRIC RATING
178th/ 347
METRIC RANK
27.3%
FAMILY HOUSEHOLDS WITH CHILDREN
28.7/ 100
METRIC RATING
200th/ 347
METRIC RANK
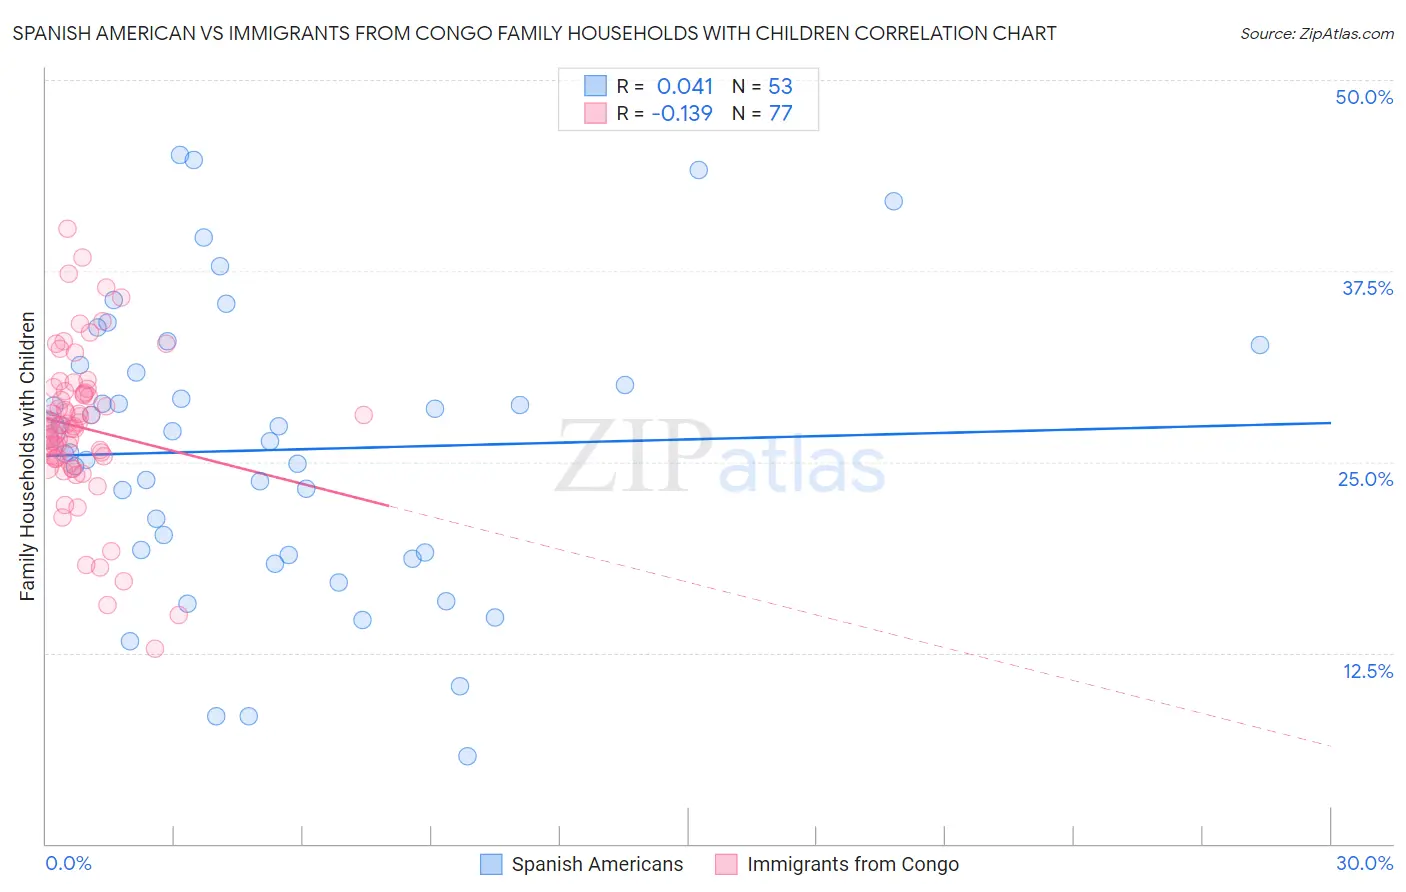
Spanish American vs Immigrants from Congo Family Households with Children Correlation Chart
The statistical analysis conducted on geographies consisting of 103,165,660 people shows no correlation between the proportion of Spanish Americans and percentage of family households with children in the United States with a correlation coefficient (R) of 0.041 and weighted average of 27.4%. Similarly, the statistical analysis conducted on geographies consisting of 92,083,447 people shows a poor negative correlation between the proportion of Immigrants from Congo and percentage of family households with children in the United States with a correlation coefficient (R) of -0.139 and weighted average of 27.3%, a difference of 0.48%.
Family Households with Children Correlation Summary
| Measurement | Spanish American | Immigrants from Congo |
| Minimum | 5.7% | 12.8% |
| Maximum | 45.1% | 40.2% |
| Range | 39.4% | 27.4% |
| Mean | 25.8% | 27.3% |
| Median | 26.3% | 27.3% |
| Interquartile 25% (IQ1) | 19.0% | 25.2% |
| Interquartile 75% (IQ3) | 31.1% | 29.6% |
| Interquartile Range (IQR) | 12.1% | 4.4% |
| Standard Deviation (Sample) | 9.3% | 5.0% |
| Standard Deviation (Population) | 9.2% | 5.0% |
Similar Demographics by Family Households with Children
Demographics Similar to Spanish Americans by Family Households with Children
In terms of family households with children, the demographic groups most similar to Spanish Americans are Ugandan (27.4%, a difference of 0.010%), White/Caucasian (27.4%, a difference of 0.020%), British (27.4%, a difference of 0.020%), Immigrants from China (27.4%, a difference of 0.020%), and Turkish (27.4%, a difference of 0.040%).
| Demographics | Rating | Rank | Family Households with Children |
| Blackfeet | 54.3 /100 | #171 | Average 27.5% |
| Israelis | 53.9 /100 | #172 | Average 27.5% |
| Immigrants | Argentina | 52.2 /100 | #173 | Average 27.5% |
| Whites/Caucasians | 50.0 /100 | #174 | Average 27.4% |
| British | 49.9 /100 | #175 | Average 27.4% |
| Immigrants | China | 49.6 /100 | #176 | Average 27.4% |
| Ugandans | 49.2 /100 | #177 | Average 27.4% |
| Spanish Americans | 48.9 /100 | #178 | Average 27.4% |
| Turks | 46.9 /100 | #179 | Average 27.4% |
| Immigrants | Turkey | 46.9 /100 | #180 | Average 27.4% |
| Aleuts | 46.7 /100 | #181 | Average 27.4% |
| Puget Sound Salish | 46.2 /100 | #182 | Average 27.4% |
| South Africans | 44.9 /100 | #183 | Average 27.4% |
| Native Hawaiians | 44.6 /100 | #184 | Average 27.4% |
| Delaware | 42.0 /100 | #185 | Average 27.4% |
Demographics Similar to Immigrants from Congo by Family Households with Children
In terms of family households with children, the demographic groups most similar to Immigrants from Congo are English (27.3%, a difference of 0.090%), Bhutanese (27.3%, a difference of 0.10%), Immigrants from Romania (27.4%, a difference of 0.15%), Cheyenne (27.4%, a difference of 0.16%), and Norwegian (27.4%, a difference of 0.16%).
| Demographics | Rating | Rank | Family Households with Children |
| Swedes | 36.9 /100 | #193 | Fair 27.4% |
| Immigrants | Iran | 36.1 /100 | #194 | Fair 27.4% |
| Crow | 35.7 /100 | #195 | Fair 27.4% |
| Cheyenne | 35.1 /100 | #196 | Fair 27.4% |
| Norwegians | 35.0 /100 | #197 | Fair 27.4% |
| Immigrants | Romania | 34.4 /100 | #198 | Fair 27.4% |
| English | 32.0 /100 | #199 | Fair 27.3% |
| Immigrants | Congo | 28.7 /100 | #200 | Fair 27.3% |
| Bhutanese | 25.1 /100 | #201 | Fair 27.3% |
| Americans | 22.8 /100 | #202 | Fair 27.3% |
| Kiowa | 22.2 /100 | #203 | Fair 27.3% |
| Immigrants | Sudan | 21.6 /100 | #204 | Fair 27.3% |
| Immigrants | Haiti | 20.3 /100 | #205 | Fair 27.2% |
| Immigrants | Micronesia | 20.2 /100 | #206 | Fair 27.2% |
| Haitians | 19.8 /100 | #207 | Poor 27.2% |