Spanish American vs Central American Indian Householder Income Ages 25 - 44 years
COMPARE
Spanish American
Central American Indian
Householder Income Ages 25 - 44 years
Householder Income Ages 25 - 44 years Comparison
Spanish Americans
Central American Indians
$83,722
HOUSEHOLDER INCOME AGES 25 - 44 YEARS
0.2/ 100
METRIC RATING
272nd/ 347
METRIC RANK
$82,355
HOUSEHOLDER INCOME AGES 25 - 44 YEARS
0.1/ 100
METRIC RATING
282nd/ 347
METRIC RANK
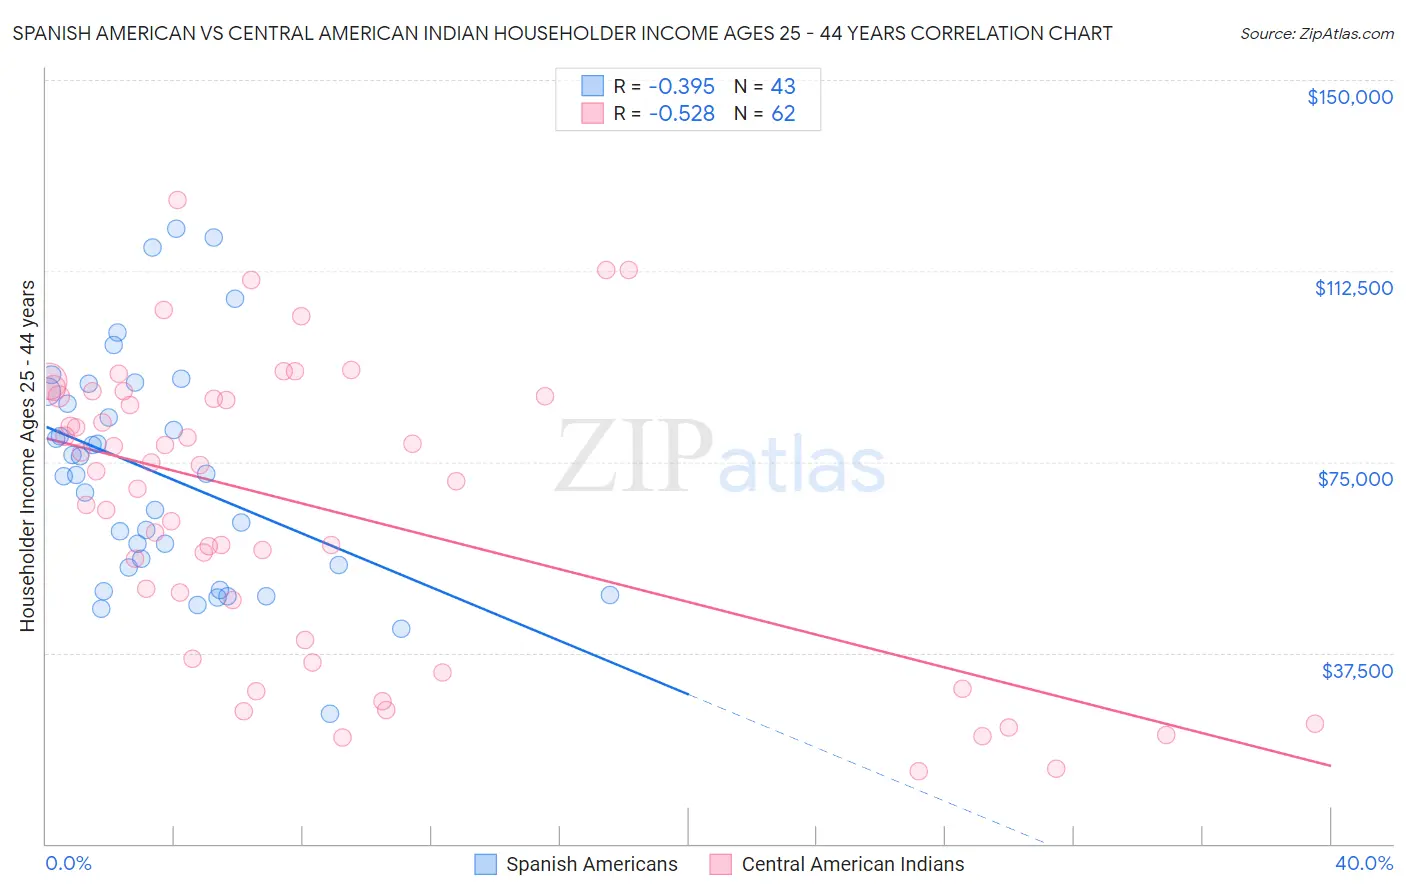
Spanish American vs Central American Indian Householder Income Ages 25 - 44 years Correlation Chart
The statistical analysis conducted on geographies consisting of 103,075,966 people shows a mild negative correlation between the proportion of Spanish Americans and household income with householder between the ages 25 and 44 in the United States with a correlation coefficient (R) of -0.395 and weighted average of $83,722. Similarly, the statistical analysis conducted on geographies consisting of 325,704,457 people shows a substantial negative correlation between the proportion of Central American Indians and household income with householder between the ages 25 and 44 in the United States with a correlation coefficient (R) of -0.528 and weighted average of $82,355, a difference of 1.7%.
Householder Income Ages 25 - 44 years Correlation Summary
| Measurement | Spanish American | Central American Indian |
| Minimum | $25,625 | $14,158 |
| Maximum | $120,725 | $126,501 |
| Range | $95,100 | $112,343 |
| Mean | $72,343 | $66,041 |
| Median | $72,340 | $72,238 |
| Interquartile 25% (IQ1) | $54,252 | $39,906 |
| Interquartile 75% (IQ3) | $88,756 | $87,781 |
| Interquartile Range (IQR) | $34,503 | $47,875 |
| Standard Deviation (Sample) | $22,283 | $28,438 |
| Standard Deviation (Population) | $22,022 | $28,208 |
Demographics Similar to Spanish Americans and Central American Indians by Householder Income Ages 25 - 44 years
In terms of householder income ages 25 - 44 years, the demographic groups most similar to Spanish Americans are Somali ($83,752, a difference of 0.040%), Iroquois ($83,682, a difference of 0.050%), Marshallese ($83,575, a difference of 0.18%), Jamaican ($83,933, a difference of 0.25%), and Spanish American Indian ($84,085, a difference of 0.43%). Similarly, the demographic groups most similar to Central American Indians are Guatemalan ($82,331, a difference of 0.030%), Cajun ($82,393, a difference of 0.050%), Immigrants from Middle Africa ($82,254, a difference of 0.12%), Immigrants from Somalia ($82,188, a difference of 0.20%), and Ute ($82,166, a difference of 0.23%).
| Demographics | Rating | Rank | Householder Income Ages 25 - 44 years |
| Hmong | 0.3 /100 | #267 | Tragic $84,258 |
| Sub-Saharan Africans | 0.3 /100 | #268 | Tragic $84,235 |
| Spanish American Indians | 0.3 /100 | #269 | Tragic $84,085 |
| Jamaicans | 0.3 /100 | #270 | Tragic $83,933 |
| Somalis | 0.2 /100 | #271 | Tragic $83,752 |
| Spanish Americans | 0.2 /100 | #272 | Tragic $83,722 |
| Iroquois | 0.2 /100 | #273 | Tragic $83,682 |
| Marshallese | 0.2 /100 | #274 | Tragic $83,575 |
| Immigrants | Jamaica | 0.2 /100 | #275 | Tragic $83,298 |
| Immigrants | Belize | 0.2 /100 | #276 | Tragic $83,141 |
| Paiute | 0.2 /100 | #277 | Tragic $82,984 |
| Senegalese | 0.2 /100 | #278 | Tragic $82,852 |
| Pima | 0.1 /100 | #279 | Tragic $82,821 |
| Colville | 0.1 /100 | #280 | Tragic $82,604 |
| Cajuns | 0.1 /100 | #281 | Tragic $82,393 |
| Central American Indians | 0.1 /100 | #282 | Tragic $82,355 |
| Guatemalans | 0.1 /100 | #283 | Tragic $82,331 |
| Immigrants | Middle Africa | 0.1 /100 | #284 | Tragic $82,254 |
| Immigrants | Somalia | 0.1 /100 | #285 | Tragic $82,188 |
| Ute | 0.1 /100 | #286 | Tragic $82,166 |
| Immigrants | Latin America | 0.1 /100 | #287 | Tragic $82,166 |