Immigrants from Honduras vs Immigrants from Congo Householder Income Ages 25 - 44 years
COMPARE
Immigrants from Honduras
Immigrants from Congo
Householder Income Ages 25 - 44 years
Householder Income Ages 25 - 44 years Comparison
Immigrants from Honduras
Immigrants from Congo
$77,328
HOUSEHOLDER INCOME AGES 25 - 44 YEARS
0.0/ 100
METRIC RATING
323rd/ 347
METRIC RANK
$72,178
HOUSEHOLDER INCOME AGES 25 - 44 YEARS
0.0/ 100
METRIC RATING
340th/ 347
METRIC RANK
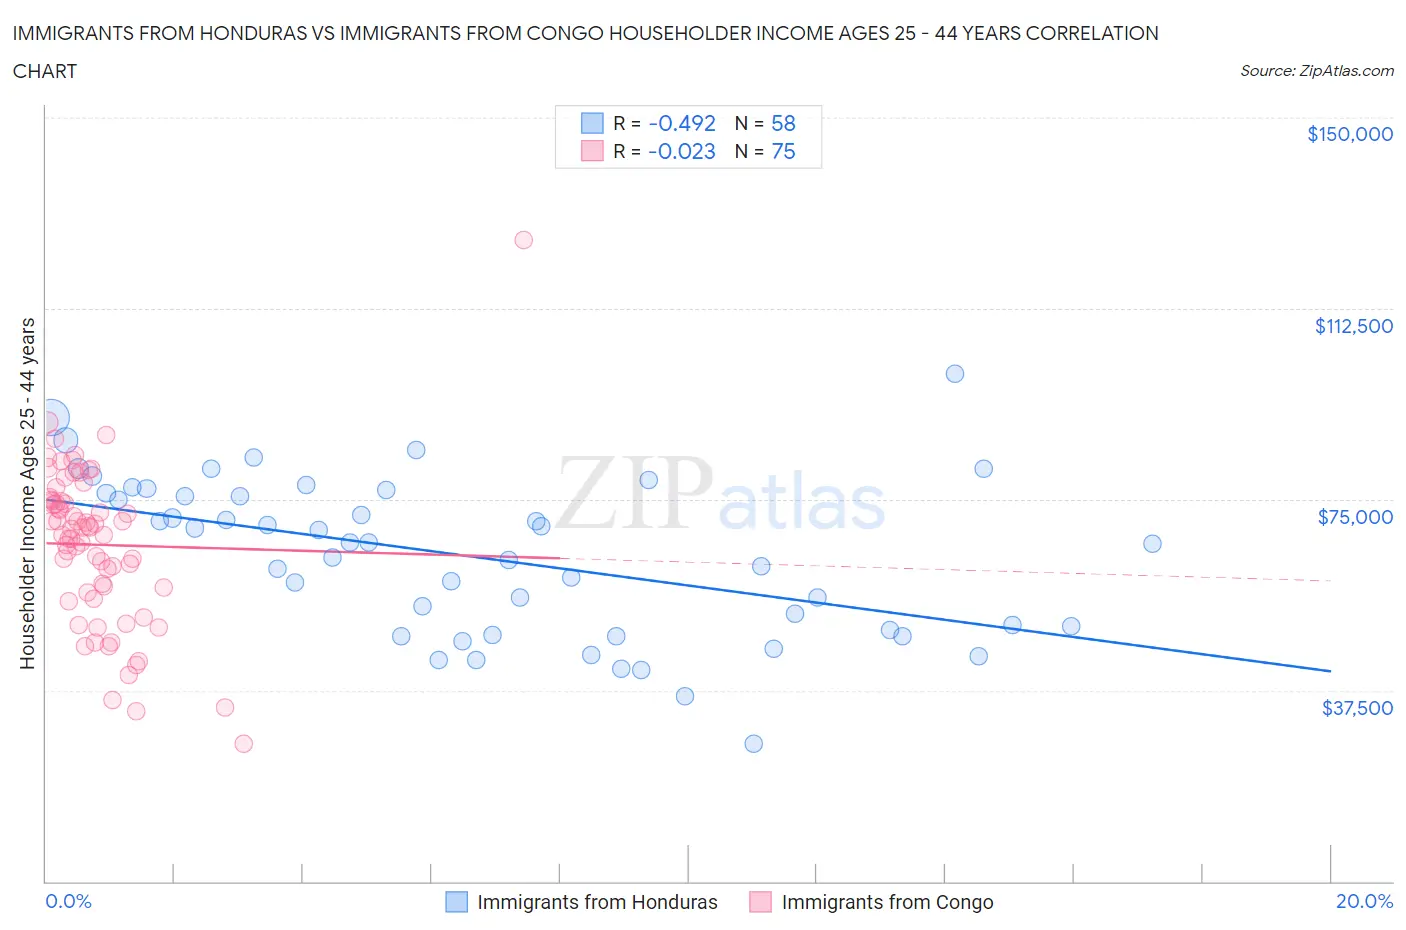
Immigrants from Honduras vs Immigrants from Congo Householder Income Ages 25 - 44 years Correlation Chart
The statistical analysis conducted on geographies consisting of 321,952,844 people shows a moderate negative correlation between the proportion of Immigrants from Honduras and household income with householder between the ages 25 and 44 in the United States with a correlation coefficient (R) of -0.492 and weighted average of $77,328. Similarly, the statistical analysis conducted on geographies consisting of 92,043,798 people shows no correlation between the proportion of Immigrants from Congo and household income with householder between the ages 25 and 44 in the United States with a correlation coefficient (R) of -0.023 and weighted average of $72,178, a difference of 7.1%.
Householder Income Ages 25 - 44 years Correlation Summary
| Measurement | Immigrants from Honduras | Immigrants from Congo |
| Minimum | $26,956 | $27,125 |
| Maximum | $99,657 | $125,889 |
| Range | $72,701 | $98,764 |
| Mean | $63,676 | $66,077 |
| Median | $66,366 | $69,302 |
| Interquartile 25% (IQ1) | $49,234 | $56,796 |
| Interquartile 75% (IQ3) | $76,183 | $74,591 |
| Interquartile Range (IQR) | $26,949 | $17,795 |
| Standard Deviation (Sample) | $15,519 | $15,700 |
| Standard Deviation (Population) | $15,385 | $15,595 |
Demographics Similar to Immigrants from Honduras and Immigrants from Congo by Householder Income Ages 25 - 44 years
In terms of householder income ages 25 - 44 years, the demographic groups most similar to Immigrants from Honduras are Dutch West Indian ($77,260, a difference of 0.090%), Sioux ($77,089, a difference of 0.31%), Houma ($77,044, a difference of 0.37%), Immigrants from Bahamas ($76,910, a difference of 0.54%), and Chickasaw ($77,929, a difference of 0.78%). Similarly, the demographic groups most similar to Immigrants from Congo are Arapaho ($71,697, a difference of 0.67%), Yuman ($72,956, a difference of 1.1%), Immigrants from Yemen ($73,043, a difference of 1.2%), Black/African American ($73,370, a difference of 1.7%), and Yup'ik ($73,688, a difference of 2.1%).
| Demographics | Rating | Rank | Householder Income Ages 25 - 44 years |
| Immigrants | Zaire | 0.0 /100 | #321 | Tragic $78,045 |
| Chickasaw | 0.0 /100 | #322 | Tragic $77,929 |
| Immigrants | Honduras | 0.0 /100 | #323 | Tragic $77,328 |
| Dutch West Indians | 0.0 /100 | #324 | Tragic $77,260 |
| Sioux | 0.0 /100 | #325 | Tragic $77,089 |
| Houma | 0.0 /100 | #326 | Tragic $77,044 |
| Immigrants | Bahamas | 0.0 /100 | #327 | Tragic $76,910 |
| Immigrants | Cuba | 0.0 /100 | #328 | Tragic $76,701 |
| Seminole | 0.0 /100 | #329 | Tragic $76,584 |
| Yakama | 0.0 /100 | #330 | Tragic $76,226 |
| Natives/Alaskans | 0.0 /100 | #331 | Tragic $75,647 |
| Bahamians | 0.0 /100 | #332 | Tragic $75,395 |
| Hopi | 0.0 /100 | #333 | Tragic $75,002 |
| Creek | 0.0 /100 | #334 | Tragic $74,847 |
| Kiowa | 0.0 /100 | #335 | Tragic $74,776 |
| Yup'ik | 0.0 /100 | #336 | Tragic $73,688 |
| Blacks/African Americans | 0.0 /100 | #337 | Tragic $73,370 |
| Immigrants | Yemen | 0.0 /100 | #338 | Tragic $73,043 |
| Yuman | 0.0 /100 | #339 | Tragic $72,956 |
| Immigrants | Congo | 0.0 /100 | #340 | Tragic $72,178 |
| Arapaho | 0.0 /100 | #341 | Tragic $71,697 |